Selecting a Nondefault Resolution for a Query
Specify a nondefault value for resolution for querying metric data in Monitoring.
These instructions apply to metric queries only (SummarizeMetricsData). Resolution can't be selected for alarm queries (CreateAlarm). The only valid value of the resolution for an alarm query request is
1m.
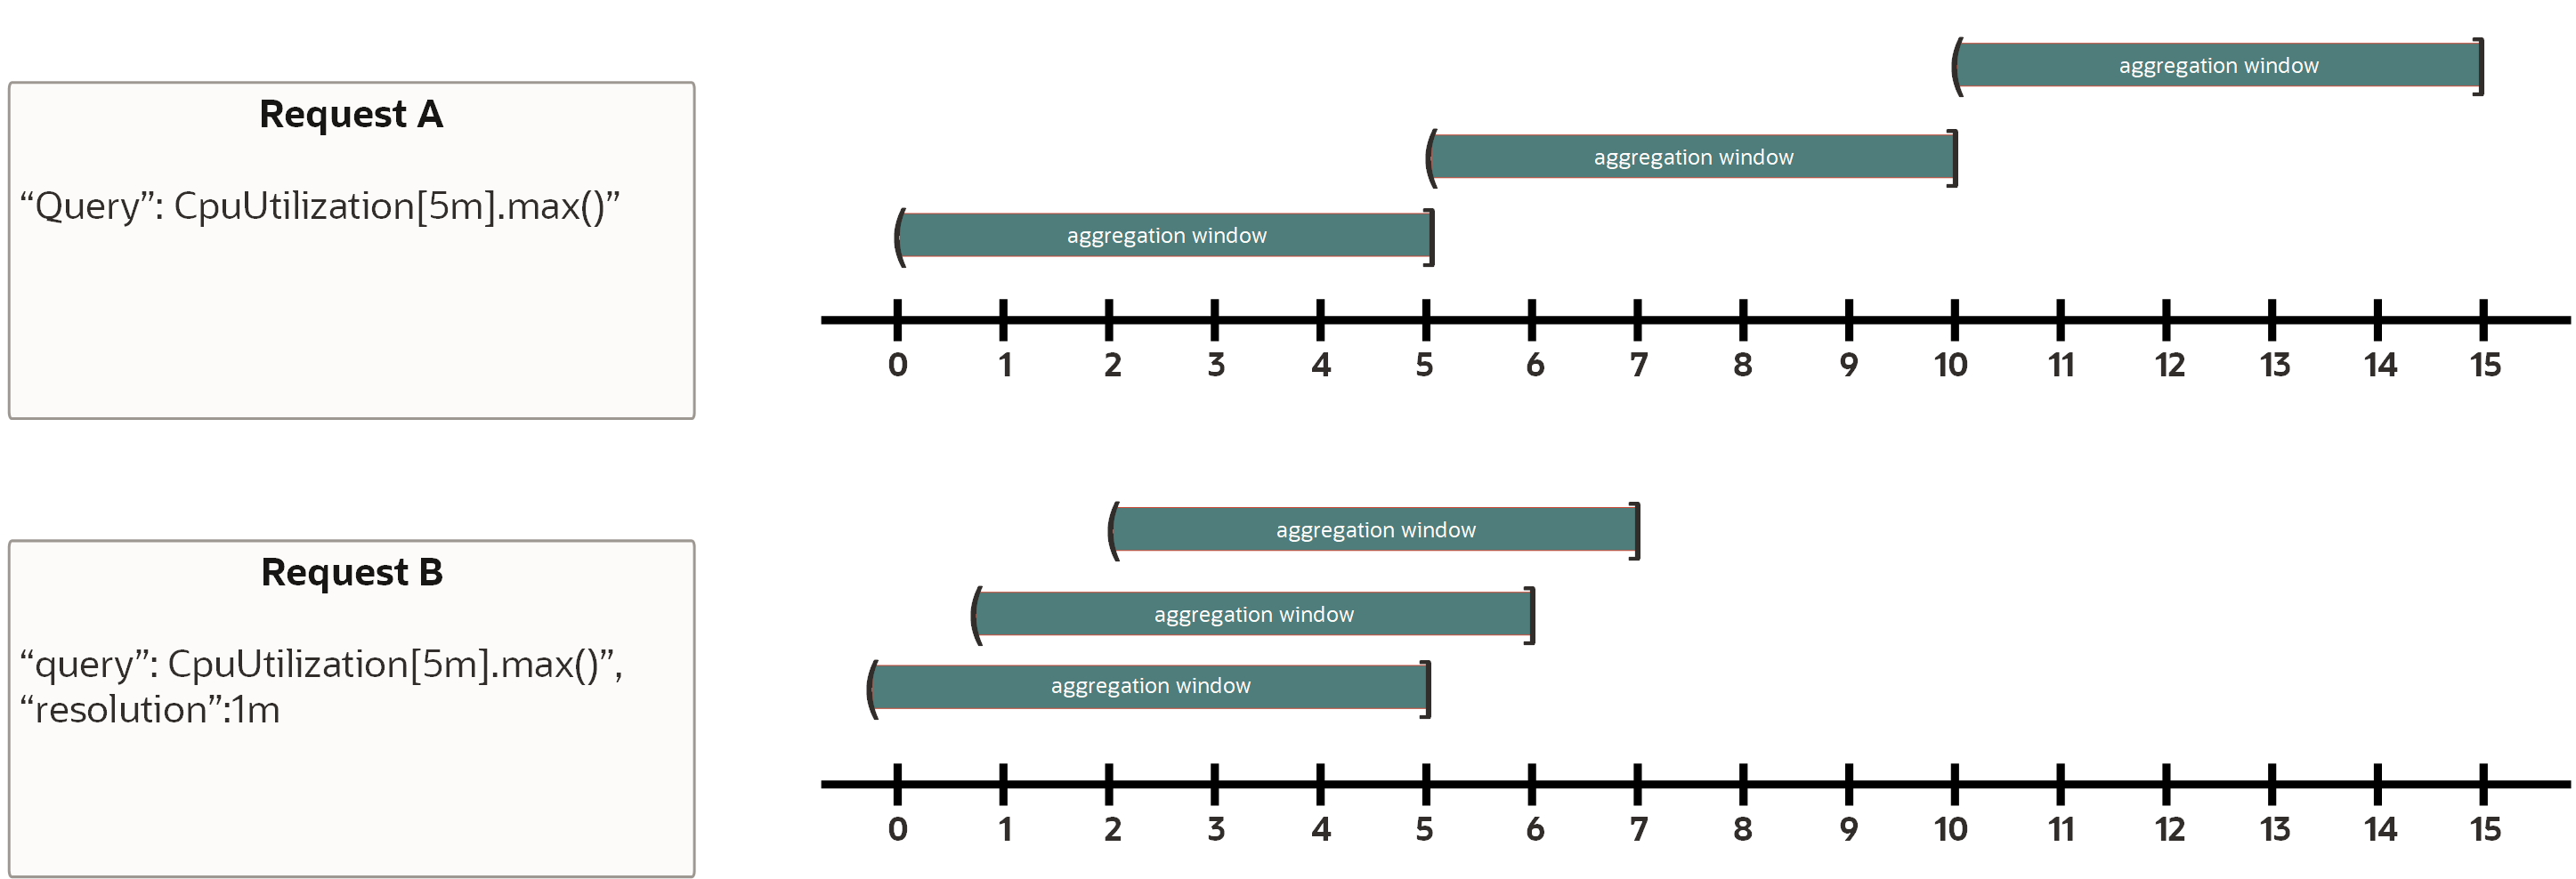
As shown in the following illustration, resolution controls the start time of each aggregation window relative to the previous window while interval controls the length of the windows. Both requests apply the statistic max to the data within each five-minute window (from the interval), resulting in a single aggregated data point representing the highest CPUutilization counter for that window. Only the resolution value differs. This resolution changes the regularity at which the aggregation windows shift, or the start times of successive aggregation windows. Request A doesn't specify a resolution and thus uses the default value equal to the interval (5 minutes). This request's five-minute aggregation windows are thus taken from the sets of data points emitted from 0:n to 5:00, 5:n to 10:00, and so forth. Request B specifies a 1-minute resolution, so its five-minute aggregation windows are taken from the set of data points emitted every minute from 0:n to 5:00, 1:n to 6:00, and so forth.
For query troubleshooting, see Troubleshooting Queries.
Considerations
For metric queries, the interval you select drives the default resolution of the request, which determines the maximum time range of data returned.
The maximum time range returned for a metric query depends on the resolution. By default, for metric queries, the resolution is the same as the query interval.
The maximum time range is calculated using the current time, regardless of any specified end time. Following are the maximum time ranges returned for each interval selection available in the Console (Basic mode).
| Interval | Default resolution (metric queries) | Maximum time range returned |
|---|---|---|
|
1 minute Auto (Service Metrics page)*, when the selected period of time is 6 hours or less |
1 minute | 7 days |
|
5 minutes Auto (Service Metrics page)*, when the selected period of time is more than 6 hours and less than 36 hours |
5 minutes | 30 days |
|
1 hour Auto (Service Metrics page)*, when the selected period of time is more than 36 hours |
1 hour | 90 days |
|
1 day |
1 day | 90 days |
* The maximum time range returned when you select Auto for Interval (Service Metrics page only) is determined by the automatic interval selection. The automatic interval selection is based on the selected period of time.
To specify a nondefault resolution that differs from the interval, see Selecting a Nondefault Resolution for a Query.
- Example 1 for Returned Data
- One-minute interval and resolution up to the current time, sent at 10:00 on January 8. No resolution or end time is specified, so the resolution defaults to the interval value of
1m, and the end time defaults to the current time (2023-01-08T10:00:00.789Z). This request returns a maximum of 7 days of metric data points. The earliest data point possible within this seven-day period would be 10:00 on January 1 (2023-01-01T10:00:00.789Z). - Example 2 for Returned Data
- Five-minute interval with one-minute resolution up to two days ago, sent at 10:00 on January 8. Because the resolution drives the maximum time range, a maximum of 7 days of metric data points is returned. While the end time specified was 10:00 on January 6 (
2023-01-06T10:00:00.789Z), the earliest data point possible within this seven-day period would be 10:00 on January 1 (2023-01-01T10:00:00.789Z). Therefore, only 5 days of metric data points can be returned in this example.
This task can't be performed using the Console. Use the oci monitoring metric-data summarize-metrics-data command and required parameters to query metric data. Use the
--resolutionparameter to select a nondefault resolution for the query.oci monitoring metric-data summarize-metrics-data --resolution <resolution> [...]For a complete list of parameters and values for CLI commands, see the Command Line Reference for Monitoring.
Run the SummarizeMetricsData operation to query metric data. Use the
resolutionattribute to select a nondefault resolution for the query.
