Scenario: Creating Dimensions for a Monitoring Target
Learn how to create dimensions for a custom metric generated by a connector. Send log data from the Logging service to metrics (Monitoring service) using Connector Hub.
This scenario involves creating a connector to generate a custom metric with dimensions referencing log data. Use this connector to move log data from Logging to Monitoring. After the data is moved, you can filter the new custom metrics using the dimensions created by the connector.
Required IAM Policy
If you're a member of the Administrators group, you already have the required access to complete this scenario. Otherwise, you need access to Monitoring.
The workflow for creating the connector includes a default policy when needed to provide permission for writing to the target service. If you're new to policies, see Getting Started with Policies and Common Policies.
Goal
This topic describes the goal of this scenario.
The goal of this scenario is to filter update events for Object Storage buckets. For example, find updates that changed buckets to public access. Finding public buckets can help prevent leakage of secrets. In addition to public access type, this scenario sets up filters for bucket name, compartment name, availability domain, versioning status, and a static value.
Setting Up This Scenario
This topic describes the tasks involved in setting up this scenario.
This scenario creates a metric from a log using the Connector Hub service. Setting up this scenario involves the following tasks:
-
Create a connector to move logs from Logging to a custom metric with dimensions in Monitoring.
-
Log data: Bucket - Update event from audit logs (_Audit log group)
Note
While this scenario uses the _Audit log group and the bucket update event, you can use the same approach with any log available in your tenancy. -
Metric namespace:
bucket_events -
Metric name:
update -
Static value
buckets-from-connector(dimension name:mytags) -
Extracted value using path dimensions:
Note
Each new dimension value creates a new metric stream. To avoid generating too many unique metric streams, which could potentially result in throttling, we recommend excluding GUIDs or UUIDs (such as compartment OCIDs) from the dimensions.
Path property (dimension name) Value bucketName logContent.data.additionalDetails.bucketName compartmentName logContent.data.compartmentName availabilityDomainlogContent.data.availabilityDomain publicAccessType logContent.data.additionalDetails.publicAccessType versioninglogContent.data.additionalDetails.versioning
-
-
Filter the moved data with the dimensions (static and extracted values).
You can complete these tasks in the Oracle Cloud Infrastructure Console, CLI, or API.
Using the Console
This topic describes how to use the Console to set up the scenario.
For help with troubleshooting, see Troubleshooting Connectors and Troubleshooting Notifications.
This topic describes how to use the Console to create a connector that moves data from a log to a custom metric with dimensions.
-
Open the navigation menu and click Analytics & AI. Under Messaging, click Connector Hub.
- Choose the Compartment where you want to create the service connector.
- Click Create connector.
-
On the Create connector page, move update events for Object Storage buckets to a custom metric with custom dimensions:
- Type a Connector name such as "Bucket - Update." Avoid entering confidential information.
- Select the Resource compartment where you want to store the new connector.
- Under Configure connector, select your source and target services to move log data to a metric:
- Source: Logging
- Target: Monitoring
- Under Configure source connection, select audit logs:
- Compartment: The compartment containing the log data.
- Log group: _Audit
- Logs: (leave empty)
- Under Log filter task, select the update event for Object Storage buckets:
- Filter type: Event type
- Service name: Object Storage
- Event type: Object - Update
- Skip Configure task.
- Under Configure target connection, enter the custom
metric namespace and custom metric name that you want to use for the
filtered log data:
- Select the Compartment where you want to store the metric data points corresponding to the bucket update event.
- Enter a new Metric namespace: bucket_events. Note
When typing a new metric namespace, press ENTER to submit it. - Enter a new Metric: update
Next, create custom dimensions to tag the log data with the static value "buckets-from-connector" and to extract bucket name, compartment name, compartment OCID, availability domain, public access type, and versioning status.
- Click Add dimensions.
The Add dimensions panel appears.
- Extract the bucket name from the log data (dimension name
bucketName):-
Under Select path, browse the available log data for the
bucketNamepath.The six latest rows of log data are retrieved from the log specified under Configure source.
Example of fragment of log data, showing the
bucketNamepath:{ "datetime": 1636594090595, "logContent": { "data": { "additionalDetails": { "bucketName": "bucket-20210722-1148", -
Select the check box for the path you want.
Note
If no log data is available, then you can manually enter a path value with a custom dimension name under Edit path. The path must start withlogContent, using either dot (.) or index ([]) notation. Dot and index are the only supported JMESPath selectors. For example:logContent.data(dot notation)logContent.data[0].content(index notation)
Example path for bucket update event, using dot notation:
logContent.data.additionalDetails.bucketNameFor more information about valid path notation, see JmesPathDimensionValue.
The following image shows an example of a selected path (
bucketName) and an unselected path (eTag):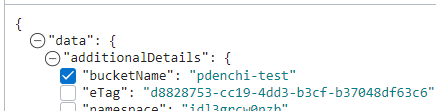
Under Edit path, the following fields are automatically populated from your selected path. You can optionally edit the default Dimension name.
Dimension name Value bucketName logContent.data.additionalDetails.bucketName
-
-
Repeat extraction for each additional value you want to use as a dimension (filter): Under Select path, select the check box for the path corresponding to the Dimension name in the following table.
The Value is automatically populated from your selected path. You can optionally edit the default Dimension name.
Dimension name Value compartmentName logContent.data.compartmentName availabilityDomainlogContent.data.availabilityDomain publicAccessType logContent.data.additionalDetails.publicAccessType versioninglogContent.data.additionalDetails.versioning - Tag the log data with the static value "buckets-from-connector" (dimension
name "mytags"): Under Static values, enter the following:
- Dimension name: mytags
- Value: buckets-from-connector
- Click Save changes.
The Add dimensions panel is closed. The focus changes to the Create connector page.
- If you are prompted to create a policy (required for access to create or update a connector), click Create.
- Click Create.
The new connector immediately begins moving log data to your custom metric
updatewith your specified dimensions.Next, filter the moved data using the dimensions.
This topic describes how to use the Console to filter data moved from a log to a custom metric with dimensions.
-
Open the navigation menu and click Observability & Management. Under Monitoring, click Metrics Explorer.
- On the Metrics Explorer page, fill in the fields for a
new query.
- Compartment: The compartment containing the metric.
- Metric namespace: bucket_events
- Metric name: update
-
Interval: 1m
-
Statistic: Count
-
Metric dimensions: Add the following dimensions.
Dimension name Dimension value mytagsbuckets-from-connector bucketNamebucket-20210722-1148 compartmentNamedevelopment availabilityDomainPHX-AD-3 publicAccessTypeObjectRead versioningEnabled
-
Click Update Chart.
The chart shows metric data filtered by dimension.
Congratulations! You are now filtering log data that the connector moved to a metric.
Using the CLI
This topic describes how to use the CLI to create the connector and filter the moved data.
For information about using the API and signing requests, see REST API documentation and Security Credentials. For information about SDKs, see SDKs and the CLI.
-
Define the log source for the connector: Save a file named
source.json.Example source.json file{ "kind": "logging", "logSources": [ { "compartmentId": "<compartment_OCID>", "logGroupId": "_Audit", "logId": null } ] } -
Define the target (metric and dimensions) for the connector: Save a file named
target.json.Example target.json file{ "kind": "monitoring", "compartmentId": "<compartment_OCID>", "metricNamespace": "bucket_events", "metric": "update", "dimensions": [ {"name": "mytags", "dimensionValue": {"kind": "static", "value": "buckets-from-connector"}}, {"name": "bucketName", "dimensionValue": {"kind": "jmesPath", "path": "logContent.data.additionalDetails.bucketName"}}, {"name": "compartmentName", "dimensionValue": {"kind": "jmesPath", "path": "logContent.data.compartmentName"}}, {"name": "availabilityDomain", "dimensionValue": {"kind": "jmesPath", "path": "logContent.data.availabilityDomain"}}, {"name": "publicAccessType", "dimensionValue": {"kind": "jmesPath", "path": "logContent.data.additionalDetails.publicAccessType"}}, {"name": "versioning", "dimensionValue": {"kind": "jmesPath", "path": "logContent.data.additionalDetails.versioning"}} ] } -
Create a connector: Open a command prompt and run the
oci sch service-connector createcommand:Example command for creating a connectoroci sch service-connector create --compartment-id <compartment_OCID> --display-name "Bucket - Update" --source file://source.json --target file://target.json -
Query the metric data using the custom dimensions: Open a command prompt and run the
oci monitoring metric-data summarize-metrics-datacommand:Example command for querying metric data using custom dimensionsoci monitoring metric-data summarize-metrics-data --compartment-id <compartment_OCID> --namespace bucket_events --query-text update[1m]{mytags = "buckets-from-connector", bucketName = "bucket-20210722-1148", coompartmentName = "development", availabilityDomain = "PHX-AD-3", publicAccessType = "ObjectRead", versioning = "Enabled"}.count()
For help with troubleshooting, see Troubleshooting Connectors and Troubleshooting Notifications.
Using the API
This topic describes how to use the API to create the connector and filter the moved data.
For information about using the API and signing requests, see REST API documentation and Security Credentials. For information about SDKs, see SDKs and the CLI.
Use the following operations:
-
CreateServiceConnector: Create a connector.
Example CreateServiceConnector requestPOST /20200909/serviceConnectors Host: service-connector-hub.us-phoenix-1.oraclecloud.com <authorization and other headers> { "compartmentId": "<compartment_OCID>", "displayName": "Bucket - Update", "source": { "kind": "logging", "logSources": [ { "compartmentId": "<compartment_OCID>", "logGroupId": "_Audit", "logId": null } ] }, "target": { "compartmentId": "<compartment_OCID>", "dimensions": [ {"name": "mytags", "dimensionValue": {"kind": "static", "value": "buckets-from-connector"}}, {"name": "bucketName", "dimensionValue": {"kind": "jmesPath", "path": "logContent.data.additionalDetails.bucketName"}}, {"name": "compartmentName", "dimensionValue": {"kind": "jmesPath", "path": "logContent.data.compartmentName"}}, {"name": "availabilityDomain", "dimensionValue": {"kind": "jmesPath", "path": "logContent.data.availabilityDomain"}}, {"name": "publicAccessType", "dimensionValue": {"kind": "jmesPath", "path": "logContent.data.additionalDetails.publicAccessType"}}, {"name": "versioning", "dimensionValue": {"kind": "jmesPath", "path": "logContent.data.additionalDetails.versioning"}} ] "kind": "monitoring", "metric": "update", "metricNamespace": "bucket_events" } } -
SummarizeMetricsData: Query the metric data by dimensions.
Example SummarizeMetricsData requestPOST /20180401/metrics/actions/summarizeMetricsData?compartmentId=<compartment_OCID> Host: telemetry.us-phoenix-1.oraclecloud.com <authorization and other headers> { "namespace": "bucket_events", "query": "update[1m]{mytags = "buckets-from-connector", bucketName = "bucket-20210722-1148", coompartmentName = "development", availabilityDomain = "PHX-AD-3", publicAccessType = "ObjectRead", versioning = "Enabled"}.count()" }
For help with troubleshooting, see Troubleshooting Connectors and Troubleshooting Notifications.