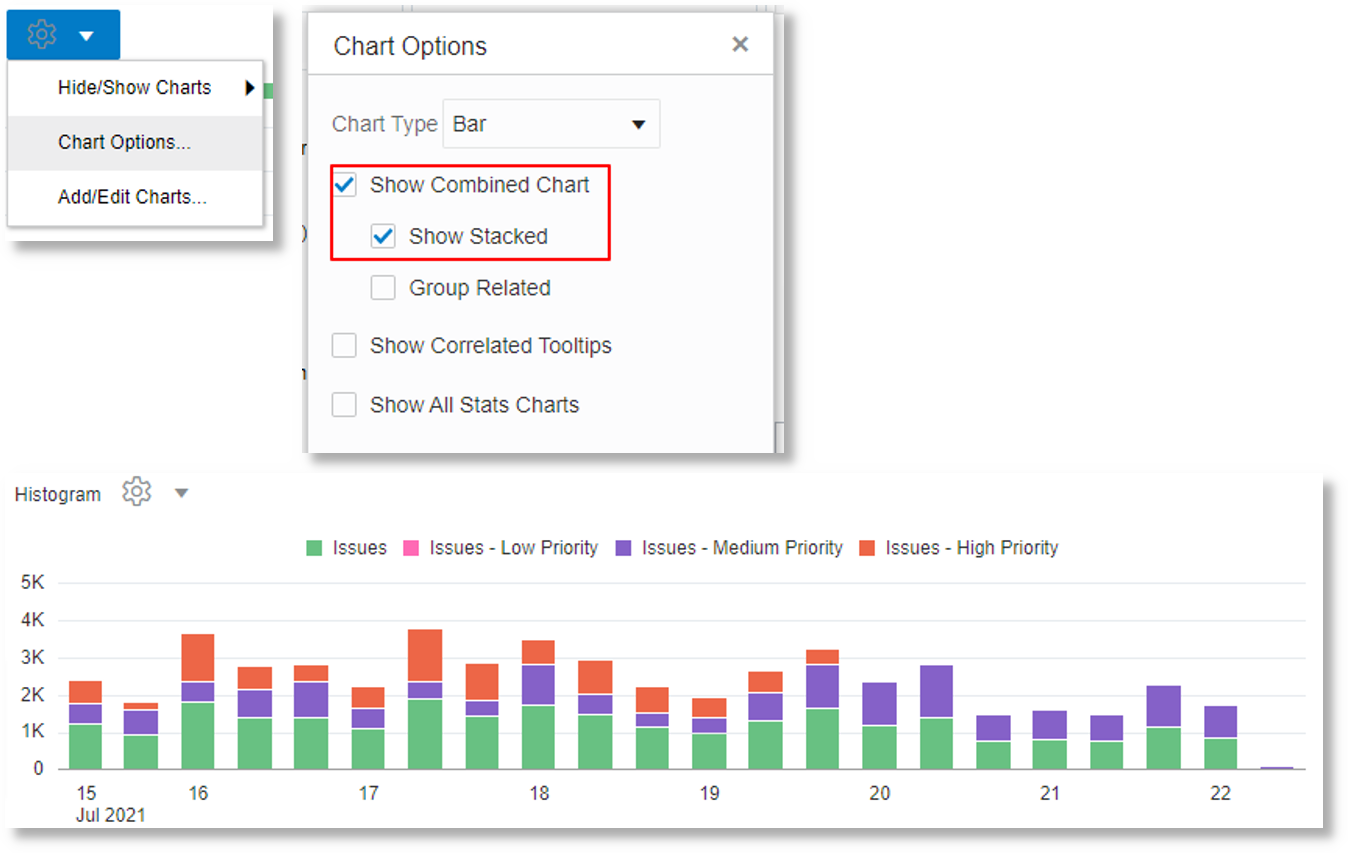
Combine and Stack Histogram Charts
You can combine and stack charts using the Show Combined and Show Stacked options in link.
For example, the following query shows the trend of logs with various values for the Problem Priority field, in a stacked chart:
*
| link Time, Entity
| addfields
   [ 'Problem Priority' != null  | stats count as Issues ],
   [ 'Problem Priority' = Low    | stats count as 'Issues - Low Priority'    ],
   [ 'Problem Priority' = Medium | stats count as 'Issues - Medium Priority' ],
   [ 'Problem Priority' = High   | stats count as 'Issues - High Priority'   ]
| fields -Issues, -'Issues - Low Priority', -'Issues - Medium Priority', -'Issues - High Priority'