View the Topology of Your Entities
Use the Topology Viewer to expand the entity configuration and view the composite entities, their dependents, and their relationships.
To access and use the Topology Viewer, open the Scope Filter, click the Topology
Viewer icon ![]() , and select the entity to view in it. See Use Scope Filters. If you select the entity in the scope filter entity panel, then click
Apply to get the updated view in the Topology Viewer.
, and select the entity to view in it. See Use Scope Filters. If you select the entity in the scope filter entity panel, then click
Apply to get the updated view in the Topology Viewer.
To include the logs of the dependent entities while filtering the logs, check the Include Dependent Entities check box.

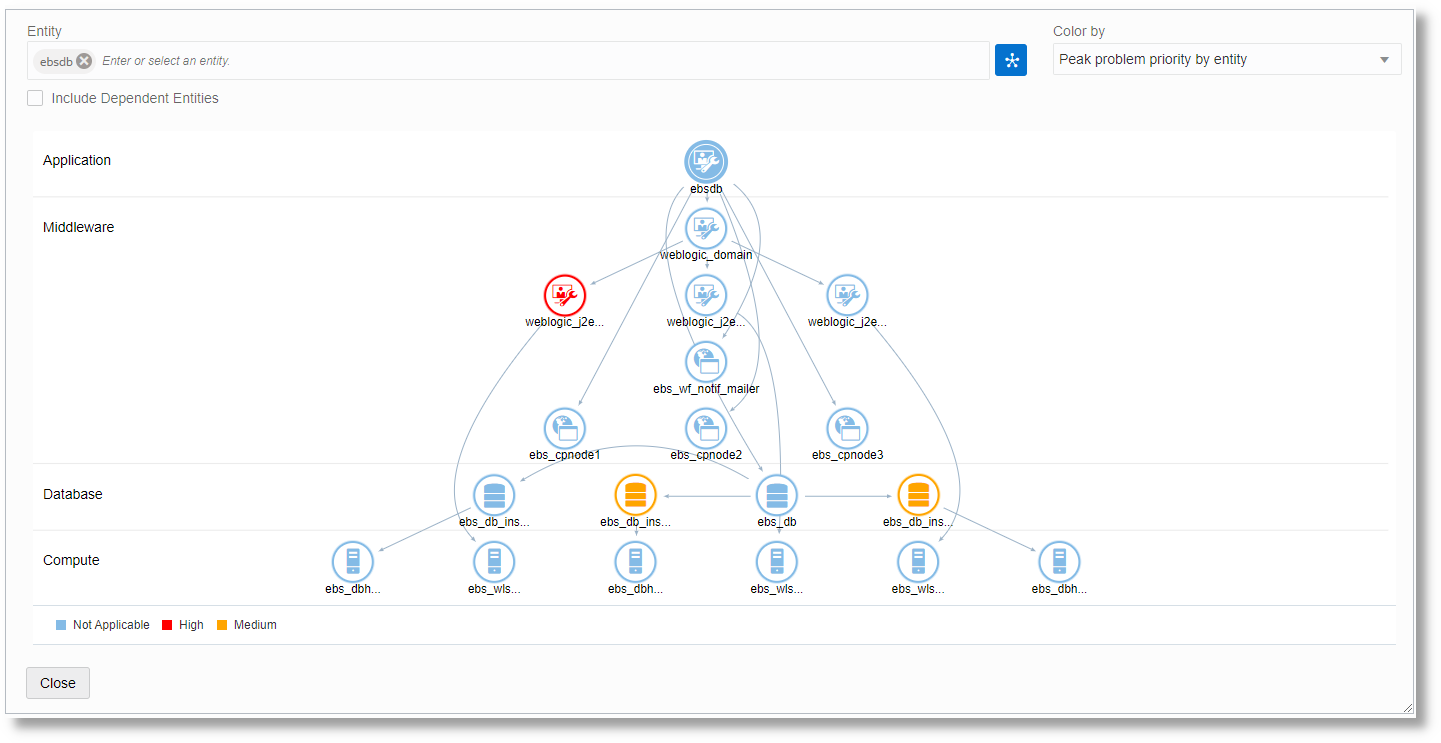
In the topology visualization, the various layers of the composite entity configuration and the entities in each layer are displayed. You can also view the dependencies and relationships depicted with the arrows.
In the above example, the composite ebsdb is selected in
the entity selector and the resulting topology is displayed. The query in the query bar
is automatically updated to show the logs for the selected composite entity. When you
click on a node in the topology visualization, for example ebs_cpnode2,
the selected node is added to the entity selector, and the check box to include the
dependent entities is automatically unchecked. As a result, the query is updated to show
only the logs for the entities added to the entity selector, and not their dependents.
When you check the check box Include Dependent Entities, the query in the query bar is automatically updated to show the logs for the selected composite entity and its dependent entities.
To deselect a previously selected node, click on it.
Use Colors to View Status of Your Entities
Use the Color by option for an indication of any issues or status of each entity based on different criteria. Each of these options is an Oracle-defined saved search that can also be opened and analyzed in the Log Explorer.
-
Peak Problem Priority by Entity: For the selected time range, view the labels that are added to the log entries for each entity and identify the highest level of marked problem priority based on those labels.
Color indication: green - none; yellow - low; orange - medium; red - high;
-
Recent outlier clusters by entity (last 24 hours): Regardless of the selected time range, view the occurrences of outliers for clusters for the given entity for the last 24 hours. An outlier is any cluster that only had one log entry occurrence during the time period.
Color indication: green - no outlier clusters detected; yellow - more than one outlier cluster; orange - more than five outlier clusters; red - more than ten outlier clusters found in the last 24 hours;
-
Recent problem clusters by entity (last 24 hours): Regardless of the selected time range, view the occurrences of detected problems for clusters for the given entity for the last 24 hours. A problem cluster is any cluster that contains log entries having text with a problem like
fatalorerror.Color indication: green - no problem clusters detected; yellow - more than one problem cluster; orange - more than five problem clusters; red - more than ten problem clusters found in the last 24 hours;