Install Software to Expose Metrics in Prometheus Format
Management Agent can work with any preferred software that exposes metrics in Prometheus format.
In this example, we are using the Prometheus Node Exporter which exposes a wide variety of hardware and kernel-related metrics for UNIX and Linux kernels. For more details about Prometheus Node Exporter, see Node Exporter Github.
To install and run a Node Exporter on a VM, do the following:
- Download the Node Exporter tar file.
wget https://github.com/prometheus/node_exporter/releases/download/v*/node_exporter-*.*-amd64.tar.gz - Untar the downloaded file.
tar xvfz node_exporter-*.*-amd64.tar.gz - Run Node Exporter on a VM.
cd node_exporter-*.*-amd64
./node_exporter
The output looks similar to the following:INFO[0000] Starting node_exporter (version=0.16.0, branch=HEAD, revision=d42bd70f4363dced6b77d8fc311ea57b63387e4f) source="node_exporter.go:82" INFO[0000] Build context (go=go1.9.6, user=root@a67a9bc13a69, date=20180515-15:53:28) source="node_exporter.go:83" INFO[0000] Enabled collectors: source="node_exporter.go:90" INFO[0000] - boottime source="node_exporter.go:97" ... INFO[0000] Listening on :9100 source="node_exporter.go:111"The above indicates the Node Exporter is running and exposing metrics on the default port: 9100.
- Verify Node Exporter installation.
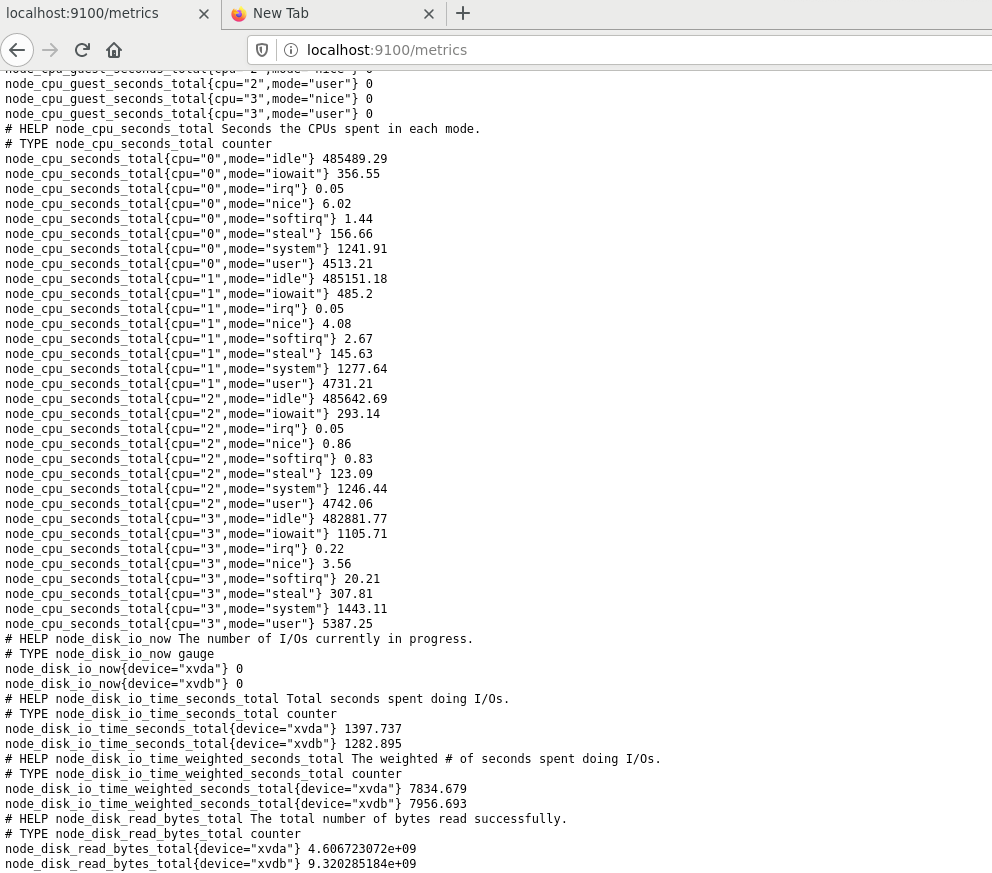
To verify that the metrics are being exported, use the following:
http://localhost:9100/metricsThe output looks similar to the following:
 Another way to verify the installation is to run
curlfrom the command line on the same endpoint like the following:curl http://localhost:9100/metricsThe output looks similar to the following:# Output: # HELP node_cpu_seconds_total Seconds the CPUs spent in each mode. # TYPE node_cpu_seconds_total counter node_cpu_seconds_total{cpu="0",mode="idle"} 485489.29 node_cpu_seconds_total{cpu="0",mode="iowait"} 356.55 node_cpu_seconds_total{cpu="0",mode="irq"} 0.05 node_cpu_seconds_total{cpu="0",mode="nice"} 6.02 node_cpu_seconds_total{cpu="0",mode="softirq"} 1.44 node_cpu_seconds_total{cpu="0",mode="steal"} 156.66 node_cpu_seconds_total{cpu="0",mode="system"} 1241.91 node_cpu_seconds_total{cpu="0",mode="user"} 4513.21 node_cpu_seconds_total{cpu="1",mode="idle"} 485151.18 node_cpu_seconds_total{cpu="1",mode="iowait"} 485.2