Analyze Available Host Memory Resources
For a complete view of memory usage across all Ops Insights enabled hosts, click Memory under Resources in the left navigation menu.
By default, you view comprehensive memory usage for each host. Viewing the memory utilization for each host lets you compare resource utilization between hosts and identify underused or overused resources. For each host, you view the following:
- Platform Type: The following platforms are supported:
- Linux (including Ubuntu)
- Solaris
- Windows
- zLinux
- AIX
- HP-UX
- Usage (GB): 90th percentile value of the daily average memory usage over the selected time period
- Capacity (GB): Maximum allocation of host memory
- Utilization (%):Utilization percentage for the 90th percentile value of the daily average memory usage over the selected time period
- Usage Change (%): Percentage change in the linear trend of Memory Usage over the selected time period.
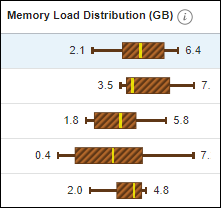
- Memory Load Distribution (GB): Host Memory Load value in (GB) (min, 25th percentile, average, 75th percentile, max) of the daily average over the selected time period. Column sorted by max load value. See below for more information.
Note
The Memory Load Distribution metric is not available for hosts monitored by Enterprise Manager. - HugePages Memory (MB): Host total HugePages memory used in MB. See below for more information.
Note
HugePages Memory is not available for hosts monitored by Enterprise Manager. However, minimum, maximum, and average load values are still shown. - Ops Insights State: Current state of the host, will show enabled, disabled, or terminated depending on the host state.
About Memory Load Distribution
The Memory Load Distribution column provides, at a glance, a comprehensive look at the memory load for each host enabled for Ops Insights.

Each host memory load distribution chart provides essential statistical information and characterizes the distribution of data. At the opposite ends of the chart are the extreme minimum and maximum load values. You see a brown striped bar representing 50% of the collected data (load data falling between the first and third quartile) and shows you at a glance where the load data is compressed, or biased towards the minimum or maximum. A vertical line indicates the median value.
A wide striped bar around the median indicates there is a high amount of memory load variability. A narrow striped bar around the median indicates a limited range of memory load variability.
The memory load distribution chart provides a comprehensive view of the load being place on a single host and gives you insight into optimizing memory load for that host. When comparing multiple hosts in, for example, a RAC environment, the view lets you see how the load is distributed. If you see load anomalies, it indicates you may need to rebalance the workload across servers.
While the mean and quartile ranges are relative across all hosts, the endpoints (minimum and maximum) are aligned using the same scale, so it’s easy to compare memory load across all hosts.
About HugePages Memory
HugePages is a feature integrated into the Linux kernel 2.6. Enabling HugePages makes it possible for the operating system to support memory pages greater than the default (usually 4KB). Using very large page sizes can improve system performance by reducing the amount of system resources required to access page table entries. HugePages is useful for both 32-bit and 64-bit configurations. HugePage sizes vary from 2MB to 256MB, depending on the kernel version and the hardware architecture. For Oracle Databases, using HugePages reduces the operating system maintenance of page states, and increases Translation Lookaside Buffer (TLB) hit ratio.
Analyze Trend and Forecast Memory Usage
Selecting a host from the memory insights table, you can view memory consumption as well as the trend and usage forecast for that host. Alternatively, you can also specify the breakdown by Databases to view trend and forecast analysis for all databases running on that host or Top 5 Processes where the top 5 processes are shown based on physical memory usage. Data for the Top 5 Processes is aggregated per command executed and is collected every minute. The top 10 processes are collected as the data may not be contiguous depending on the variability of the processes.
By default, trending and forecasting are calculated using linear regression. For more advanced analysis, you can have Ops Insights use machine learning to perform the trending and forecasting.
Memory charts analysis and usage are similar to those used elsewhere in the Capacity Planning application. For an in-depth discussion about Capacity Planning charts, see: