Enterprise Manager Warehouse

The Enterprise Manager (EM) repository contains critical information such as operational, performance and configuration metrics, and target inventory data for the targets monitored by Enterprise Manager. EM Warehouse provides a convenient way to access and analyze this data using cloud-based tools and services.

EM Warehouse Deployment Options

There are two options for deploying EM Warehouse that take different approaches to storing EM data and that provide you with different data analysis options.

  • Option 1

    Enterprise Manager data is loaded into OCI Object Store. With this option, you can use the published Jupyter Notebooks, or build your own analytics on top of the data in OCI Object Store

  • Option 2

    Enterprise Manager data is loaded into an Autonomous Data Warehouse (ADW) in OCI's Operations Insights service. With this option, you can write you own SQL scripts, applications, Jupyter Notebooks or use Oracle Analytics Cloud for further analysis of the data.

EM Warehouse continuously ingests Enterprise Manager repository infrastructure monitoring and configuration metric data (from one or more repositories) and stores it in an ADW Warehouse or OCI Object Store. With direct access to raw observability and manageability data, you can gain insight into the current and future state of targets as well as solve use-cases around finding noisy-neighbors across targets and running statistical models to predict future forecasts for EM-managed targets.

Note

The operational data from Enterprise Manager Cloud Control instances is retained for the last 25 months from the current date.
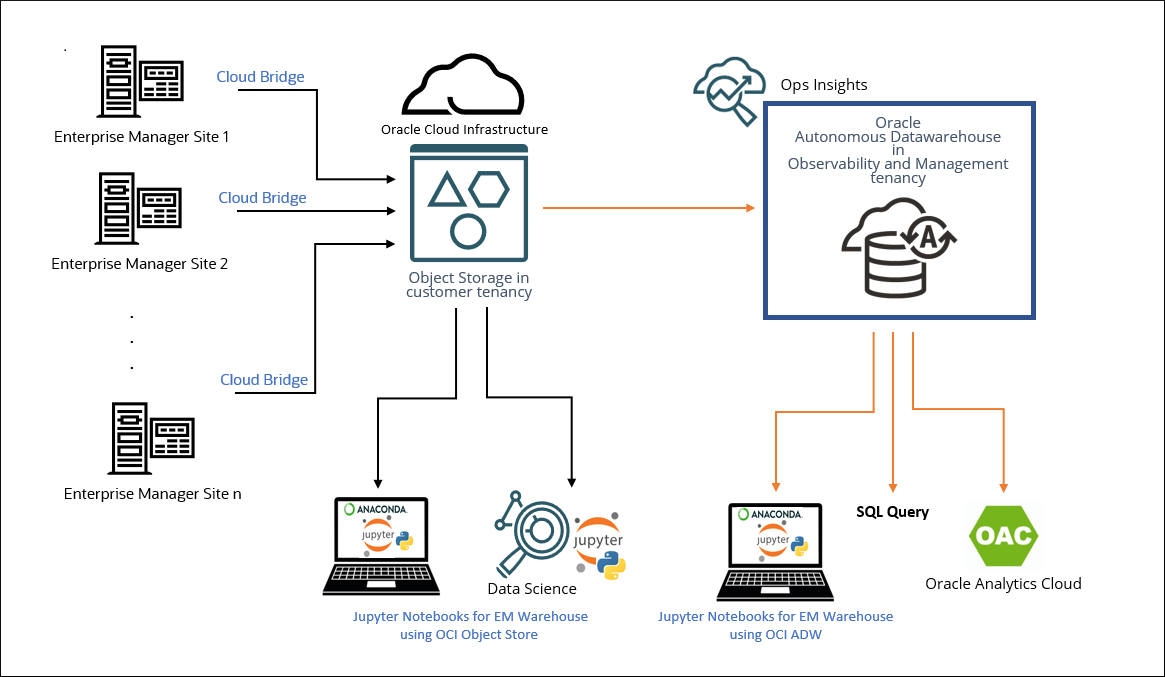
Image shows EM Warehouse deployment for versions 1 and 2.

As shown in the following graphic, EM repository data is uploaded via Cloud Bridge to an OCI Object Storage Bucket in your tenancy. From there, data is transferred via EM Bridge to an Operations Insights Warehouse. EM Warehouse is a schema within the Operations Insights Autonomous Data Warehouse.


Image shows the data flow for an EM Warehouse.

Note

EM Warehouse Licensing

The use of Enterprise Manager Warehouse (EM Warehouse) features requires an OCI Operations Insights Service subscription.

Note

Pricing

The use of Enterprise Manager Warehouse (EM Warehouse) features requires an OCI Operations Insights Service license subscription of following:

  • Oracle Cloud Infrastructure Operations Insights for Warehouse - Extract - Gigabyte Per Month- Oracle Cloud
  • Infrastructure Operations Insights for Warehouse - Instance - OCPU Per Hour

EM Warehouse Setup and Configuration

Step 1: Export EM Data to OCI

You need to configure Enterprise Manager to export resource data to OCI.

Prerequisites

Required Policy for Cloud Bridge:

allow group <user_group> to manage opsi-warehouses in tenancy

Required Policies for Autonomous Data Warehouse:

allow group <user_group> to {OPSI_EM_WAREHOUSE_CREATE} in tenancy
allow group <user_group> to {OPSI_EM_WAREHOUSE_INSPECT} in tenancy
allow group <user_group> to {OPSI_EM_WAREHOUSE_READ} in tenancy
allow group <user_group> to {OPSI_EM_WAREHOUSE_DELETE} in tenancy
allow group <user_group> to {OPSI_EM_WAREHOUSE_UPDATE} in tenancy

Alternatively, the above policies are covered by the following:

allow group <user_group> to manage opsi-em-warehouse-family in tenancy

For more information on policies required by Operations Insights, see OCI Prerequisites: Set Up Groups, Users and Policies.

  1. Navigate to your OCI environment, make a note of some specifics of your environment and create an OCI storage bucket:
    1. Make a note of your tenancy OCID, User OCID, Public Key Fingerprint, Private Key and Region. For more information, see Required Keys and OCIDs and Where to Get the Tenancy's OCID and User's OCID.
    2. Ensure that appropriate policies are set in order to have access to Object Storage. See Common Policies.
    3. Navigate to the base URL for the OCI Storage (this will vary based on your region, for example https://cloud.oracle.com/object-storage/buckets?region=us-phoenix-1) and create your own private bucket. Make a note of your private bucket name, as shown below. For more information, see Managing Buckets and Using the Console - Create a Bucket.
      Image shows the OCI storage bucket details page.

  2. On the EM side, log in as a Super Administrator and create a Named Credentials for OCI (your identification to OCI)
    1. From the Setup menu, select Security and then Named Credentials. Click Create. The Create Credential page displays.
    2. Input your OCI details you noted above, Tenancy OCID, User OCID, Public Key Fingerprint and Private Key. Click Save.
      Graphic shows the OCI details

  3. Create Host Preferred Credentials for all hosts supporting the targets you want to export data from. The user provided in the preferred host credential should be the same as the user that was used to push the agent on the host. This user should have read, write and execute privileges on the content in the agent folder. Navigate to Setup and then Preferred Credentials to assign these credentials.
  4. Next, create a Preferred Credential for the host(s) where the primary and any additional Oracle Management Services (OMS) are installed. In addition, ensure that the Database Plug-in has been pushed to all OMS hosts. The Database Plug-in is usually pushed by default with an agent, so verify that it has not been removed.
  5. Best practice: Set up an exclusive Enterprise Manager Super Administrator user dedicated for exporting data to OCI. See Creating a New Administrator.
  6. Verify that the OMS host(s) and hosts that have agents monitoring the database targets included in the data extraction have connectivity to OCI/Object Storage.
  7. Create an Enterprise Manager group that includes all the targets for which you want data exported. See Create an Enterprise Manager group. Make a note of this group name.
  8. Log in as the newly created data exporting Super Administrator user and create an Cloud Bridge by navigating to Setup menu and then selecting Cloud Bridge.
    1. Click on Manage OCI Connectivity.
    2. Enter the credential name you created above, the base URL for the Storage Bucket (usually in the format https://cloud.oracle.com/object-storage/buckets?region=<your region>), the bucket name and optionally a name for the bridge you are about to create. Then, click Create and OK.
      Graphic shows the Manage OCI Connectivity dialog.

    3. Click on Enable Data Export
    4. Under OCI Service, select Operations Insights: EM Warehouse
    5. Select the group you created in a prior step, that contains all the targets for which you want data exported.
    6. Select the Cloud Bridge and click Submit. Data from your Enterprise Manager instance should start uploading to the OCI bucket you defined.
      Image shows the OCI Service Data Export dialog

  9. In OCI, you can verify the data stored in your storage bucket. Navigate to OCI Storage, select Buckets and, in the compartment you created your bucket, click on the name of your bucket. The data in this bucket should look similar to the one shown below. Make a note of the name of your object store folder and emid.
    Graphic shows the bucket name.

For more information on exporting data to OCI, see Integrating Enterprise Manager with OCI Services.

Step 2: Create the Operations Insights Warehouse

To create the Operations Insights Warehouse:
Note

You can skip this step if you choose to use an existing Operations Insights Warehouse.
  1. Open the navigation menu, click Observability & Management. Under Operations Insights, click Overview. The Operations Insights console displays.
  2. From the Operation Insights menu, click Administration and then Operations Insights Warehouse. The Operations Insights Warehouse page displays.
  3. Enter a Warehouse Name and the number of OCPU cores to enable.
  4. Click Create Warehouse. A work request will be submitted to create the Operations Insights Warehouse. To view the progress of the work request, click the Work Requests tab.

Step 3: Create the EM Bridge

You create an EM bridge to move target-level data from an OCI Object Storage bucket to Operations Insights.

To create an EM Bridge:

  1. Open the navigation menu and click Observability and Management. Under Operations Insights, click Administration. The Database Fleet option is selected by default in the Operation Insights navigation menu.
  2. Click EM Bridges. The EM Bridge Administration page displays.
  3. Click Create Bridge. The Create Enterprise Manager Bridge dialog displays.
  4. Enter the following:
    • EM Bridge Name: A user-friendly name that lets you easily identify the source.
    • Compartment: The compartment where the EM bridge will be located.
    • Bridge Description: A meaningful description detailing specifics about the bridge.
    • Bucket Name: The name of the Object Storage bucket where Enterprise Manager target-level data is being uploaded. For more information about buckets, see Managing Buckets.
  5. Click Create Bridge.

Step 4: Create the EM Warehouse

To create the EM Warehouse:
  1. From the Operation Insights menu, click Administration, then Operations Insights Warehouse and then EM Warehouse. The EM Warehouse page displays.
  2. Enter a name for your EM Warehouse.
  3. Select the EM bridge through which data from Enterprise Manager will be imported into the EM Warehouse. If no EM bridge is available in the current compartment, you can either click the Change Compartment drop-down list to select another compartment and from there select an existing bridge. You can click Create a new bridge to define a new EM bridge in the current compartment. For more information about creating EM bridges, see Create an EM Bridge.
  4. Click Create. A work request is submitted to create the new EM Warehouse. The creation process will take 5 to 10 minutes.
    Image shows the work request operation for EM Warehouse creation.

    Once the Work Request completes, and the EM Warehouse has been successfully created, the Lifecycle State will become Active.

Viewing ETL (Extract, Transfer, Load) Runs

The ETL Runs tab shows the data extraction jobs that have been run. The purpose of an ETL Run job is to move information that the EM bridge points to into an Autonomous Data Warehouse (ADW). An ETL Run will be processed every 24 hours if new data is present.

By monitoring ETL Runs, you can see whether data is being successfully uploaded to the EM Warehouse on a regular basis in addition to the amount of data that's regularly being transferred.


Image shows the ETL Runs list.

Step 5: Create an Operations Insights Warehouse Database User

You need to create a warehouse database user who will have read-only access to the EM Warehouse.

  1. From the Operation Insights menu, click Administration and then Operations Insights Warehouse. The Operations Insights Warehouse page displays.
  2. Click the Warehouse Database Users tab.
  3. Click Create User. The Create Warehouse Database User page displays.
  4. Enter a User Name and Password.
    Note

    Password must be 12 to 30 characters and contain at least one uppercase letter, one lowercase letter, and one number. The password cannot contain the double quote (") character or the username entered above. It must be different than the last four passwords. You cannot reuse a password within 24 hours.
  5. Select the Access type. Click EM Warehouse.
    Image shows the warehouse user db creation dialog

  6. Click Create User.

Step 6: Switch Bridges (Optional)

You can set which EM Bridge is used to upload data to EM Warehouse.

After you've created an EM Warehouse using data uploaded via a particular EM Bridge, you may find it necessary to access data from Enterprise Manager repositories that are uploading data using other EM Bridges in your tenancy. EM Warehouse provides a simple option to switch EM Bridges, thus eliminating the need to recreate the EM Warehouse.
  1. Navigate to the EM Warehouse page. From the Operations Insights left navigation menu, click Administration, then Operations Insights Warehouse, and then EM Warehouse. The EM Warehouse page displays.
  2. Click Configure. The Configure Enterprise Manager Data Warehouse dialog displays.
  3. Click Change Compartment to switch to a compartment where the desired EM Bridge exists.
    If you want to create a new EM Bridge in the current compartment, click Create a new bridge to begin the process of defining a new EM Bridge.
  4. Click Configure.

(Optional) Delete an EM Warehouse

If necessary, you can easily delete an EM Warehouse.

To delete an EM Warehouse, do the following:

  1. Open the navigation menu, click Observability & Management. Under Operations Insights, click Overview. Operations Insights console displays.
  2. From the Operation Insights menu, click Administration and then EM Warehouse. The EM Warehouse page displays.
  3. Click Delete.

    The EM Warehouse deletion process will take 5-10 minutes.

Analyze EM Warehouse Data

Once your EM Warehouse has been created, you can easily access Enterprise Manager repository data and gain insight such as configuration change history, seasonality/resource utilization, capacity planning, and database migration planning.

Listed below are three popular methods for analyzing the raw data in EM Warehouse depending on the warehouse deployment option you are running. See EM Warehouse Deployment Options for more information. You may, however, use whatever analysis tools/methods you prefer.

Using Jupyter Notebooks

You can download the Jupyter Notebooks to analyze data residing in the EM Warehouse. You have an option to use either Oracle Data Science Service or Anaconda to run these Jupyter Notebooks.

See Set Up Jupyter Notebooks for more details on setting up and configuring Jupyter Notebooks.

Note

To download Jupyter Notebooks for EM Warehouse, see Jupyter Notebooks for Oracle Enterprise Manager Warehouse.

The Jupyter Notebooks demonstrate the following:

  • The utility of high density grid plots for visualizing database instance telemetry for a wide variety of metrics collected by Enterprise Manager. The notebook displays database metrics as well as a representation of the cumulative distribution of these metrics. This notebook illustrates the use of interactive controls to enable the user to select the databases and the metrics being visualized.
    Notebook shows interactive hover.

  • A variety of chart types that are useful in understanding the distribution of database instance time series telemetry values collected by Enterprise Manager. This notebook illustrates the use of interactive controls to enable the user to select the databases and the metrics being visualized.
    Image shows the different types of graphs.

  • Advanced statistical analysis, including forecasting, for database time series telemetry values collected by Enterprise Manager. Analytics from that are either available as either native Python libraries or as third-party add-ons are demonstrated. This notebook illustrates the use of interactive controls to enable the user to select the data being visualized.
    Image shows the interactive hover information.

Using SQL Queries

You can use SQL to extract relevant data from the EM Warehouse to facilitate resource analysis.

The following SQL examples illustrate the various types of useful information that can be extracted from EM Warehouse. SQL can be run using your preferred DB interface tool. For example, Oracle SQL*Plus or Oracle SQL Developer.

Note

For a complete list of metrics collected by EM Warehouse, see EM Warehouse Metrics per Target Type.

Show All Changes for a Configuration Metric

The following SQL will display all changes that have occurred to the db_init_params configuration metric in the last 24 hours. You may use SQL*Plus or any SQL editor of your choice.

SELECT * FROM db_init_params WHERE change = 'C' and LAST_COLLECTION_TIMESTAMP > sysdate-1;

Show Latest Changes to Database Initialization Parameters

The following SQL will display parameter value changes that have occurred to the db_init_params configuration metric for a given parameter over a specific period of time. The example shows the changes for open_cursors parameter.

SELECT
    a.extractor_timestamp AS previous_timestamp,
    b.extractor_timestamp AS change_timestamp,
    a.target_guid,
    a.target_name,
    a.name,
    a.value               AS old_value,
    b.value               AS new_value
FROM
    db_init_params a,
    (
        SELECT
            extractor_timestamp,
            target_guid,
            target_name,
            name,
            value,
            change
        FROM
            db_init_params
        WHERE
                change = 'C'
            AND name = 'open_cursors'
    )              b
WHERE
        a.extractor_timestamp = (
            SELECT
                MAX(c.extractor_timestamp)
            FROM
                db_init_params c
            WHERE
                    c.extractor_timestamp < b.extractor_timestamp
                AND c.target_guid = b.target_guid
                AND c.name = b.name
        )
    AND a.name = 'open_cursors'
    AND a.target_guid = b.target_guid
ORDER BY
    a.target_guid,
    change_timestamp ASC;

Output


Image shows the SQL output for db_init_params

Target Information Changes Over Time

The following SQL extracts the targetinfo column values that have been changed over a period of time. The following example gives the OLD_VALUE (previous value) and the NEW_VALUE (current value) for display_name column and the extractor timestamp when it was changed. This query can be modified to get the changes for other columns from targetinfo such as host_name, emd_url, etc. by replacing display_name with these column names as shown in the following SQL query.

select a.extractor_timestamp as previous_timestamp,
       b.extractor_timestamp as change_timestamp,
       a.target_guid,
       a.target_name,
       a.display_name as old_value,
       b.display_name as new_value
  from targetinfo a,
    (select extractor_timestamp, target_guid, target_name, display_name, change
     from targetinfo where change='C') b
   where
      a.extractor_timestamp =
         (select MAX(c.extractor_timestamp) from targetinfo c
           where c.extractor_timestamp < b.extractor_timestamp
           and c.target_guid = b.target_guid)
     and a.target_guid = b.target_guid
     order by a.target_guid, change_timestamp asc ;

Output


Image shows targetinfo changes for a specified time period.

Property Changes Over Time

The following SQL extracts the property values that have been changed over a period of time for a given property name. It displays the OLD_VALUE (previous value) and NEW_VALUE (current value) and the extractor timestamps. The following example queries for a property called access_aud_table_max.

SELECT
    a.extractor_timestamp AS previous_timestamp,
    b.extractor_timestamp AS change_timestamp,
    a.target_guid,
    a.target_name,
    a.property_name,
    a.property_value      AS old_value,
    b.property_value      AS new_value
FROM
    properties a,
    (
        SELECT
            extractor_timestamp,
            target_guid,
            target_name,
            property_name,
            property_value,
            change
        FROM
            properties
        WHERE
                change = 'C'
            AND property_name = 'access_aud_table_max'
    )          b
WHERE
        a.extractor_timestamp = (
            SELECT
                MAX(c.extractor_timestamp)
            FROM
                properties c
            WHERE
                    c.extractor_timestamp < b.extractor_timestamp
                AND c.target_guid = b.target_guid
                AND c.property_name = b.property_name
        )
    AND a.target_guid = b.target_guid
    AND a.property_name = 'access_aud_table_max'
ORDER BY
    a.target_guid,
    change_timestamp ASC; 

Output

As shown in the following output, the value for access_aud_table_max changed from 25 to 28 on 1-Apr.


Image shows the access_aud_table_max value changed from 25 to 28 on 1-Apr.

Session Usage Distribution for Database Targets

The following SQL query gives the distribution of session usage percentage and the number of targets in each bucket. The query can be modified to add more filters for the collection timestamps or target GUIDs.

SELECT
    '0-20' AS sessionUsage,
    COUNT(*) AS numberOfTargets
FROM
    gc_metric_values_hourly
WHERE
    metric_group_name = 'Database_Resource_Usage'
    AND metric_column_name = 'session_usage'
    AND avg_value <= 20
UNION
SELECT
    '21-40' AS sessionUsage,
    COUNT(*) AS numberOfTargets
FROM
    gc_metric_values_hourly
WHERE
    metric_group_name = 'Database_Resource_Usage'
    AND metric_column_name = 'session_usage'
    AND avg_value > 20
    AND avg_value <= 40
UNION
SELECT
    '41-60' AS sessionUsage,
    COUNT(*) AS numberOfTargets
FROM
    gc_metric_values_hourly
WHERE
    metric_group_name = 'Database_Resource_Usage'
    AND metric_column_name = 'session_usage'
    AND avg_value > 40
    AND avg_value <= 60
UNION
SELECT
    '61-80' AS sessionUsage,
    COUNT(*) AS numberOfTargets
FROM
    gc_metric_values_hourly
WHERE
    metric_group_name = 'Database_Resource_Usage'
    AND metric_column_name = 'session_usage'
    AND avg_value > 60
    AND avg_value <= 80
UNION
SELECT
    '81-100' AS sessionUsage,
    COUNT(*) AS numberOfTargets
FROM
    gc_metric_values_hourly
WHERE
    metric_group_name = 'Database_Resource_Usage'
    AND metric_column_name = 'session_usage'
    AND avg_value > 80
    AND avg_value <= 100;

Output


Image shows the session output usage.

Using Oracle Analytics Cloud

Oracle Analytics Cloud (OAC) is a single and complete platform that empowers your entire organization to ask any question of any data—across any environment, on any device.

Oracle Analytics Cloud provides a variety of options for intelligent analysis of data stored in EM Warehouse without being overwhelming to deploy and manage, making it an effective way to access and capitalize on cloud analytics.

Working with data and creating connected experiences is simple and smart with Oracle Analytics Cloud:

  • Automatic visualization for all your data, whether you load it self-service or through operational integrations, so you can quickly see its shape and quality.
  • Data connectors are available for a wide array of sources, Oracle and non-Oracle.
  • Intelligence is embedded in connectors for Oracle SaaS applications, getting you to meaningful information right away and accelerating your analysis.
  • Powerful inline data preparation and visual data flows with the power of machine learning that allow you to see the steps to transform and enrich data, then automate them.
  • A Software Developer Kit enables you to incorporate custom visualizations, and an extensible framework makes it easy to embed Oracle Analytics Cloud into other applications and user experiences so people can incorporate analysis into their daily work.

For comprehensive information about OAC, see Oracle Analytics Cloud.

Prerequisite

Before you can use OAC with EM Warehouse, ensure that you have an Analytics Instance created in OAC. If not, use the following procedure:

  1. From the OCI console, select Analytics & AI, then Analytics Cloud. The Analytics Instances page displays.
  2. Click Create Instance. The Create Analytics Instance page displays.
  3. Enter the required parameters.
    • Name
    • Description
    • Create in Compartment
    • Capabilities (leave default settings)
    • License Type (leave default settings)
  4. Click Create. The newly created instance appears in the table. Note: Instance creation will table approximately 10 minutes.

Using OAC with EM Warehouse

Setting up OAC for use with the EM Warehouse ADW repository involves the following:

  • Step 1: Create a Connection to ADW
  • Step 2: Create a Dataset
  • Step 3: Create a Workbook

Step 1: Create a Connection to ADW

  1. Click on the instance to go to the instance details page.
  2. Click Analytics Home Page.
  3. On the Analytics home page, click Create and then Connection. The Create Connection dialog displays.
  4. Click Oracle Autonomous Data Warehouse.
  5. Enter the connection details:
    • Connection Name: Enter an intuitive name for your ADW connection.
    • Description: Optionally, enter a description for the connection.
    • Client Credentials: Select the wallet file to be used. Once selected, the Service Name will be populated.
    • Username: Client username.
    • Password: Client password.
    • Service Name: (populated upon wallet selection)
  6. Click Save to define the connection.

Step 2: Create a Dataset

A data set contains a set of tables you’re interested in for further analysis.

  1. From the Analytics Home Page, click Create and then Dataset. The Create Dataset dialog displays.
  2. Select the ADW connection you defined earlier. The New Dataset page displays.

    Under Schema in the tree list, you can drag and drop tables of interest to add to the dataset. When you add a table to the dataset, the table data will be displayed in two distinct regions: The lower regions displays the tabular view of the table. The upper region provides rollup information for the table in addition to graphic visualizations. For example, creating a dataset containing the GC_METRIC_VALUES_HOURLY table, would generate the following:


    Image shows a dataset created in OAC.

  3. From the File drop-down menu, select Save. The Save Dataset As dialog displays.
  4. Enter a Name and Description.
  5. Click OK. The New Dataset page becomes the home page for the data set you just defined.

Step 3: Create a Workbook

Now that you’ve finished defining the dataset, you now need to create a workbook.

  1. From the page for the data set you defined in the previous step, click Create Workbook. The New Workbook page displays. The left navigation pane displays the tables you selected for your data set.
  2. You can drag and drop tables into the work area to create visualization and define filters, if necessary. For more information about using Workbooks, see Visualizing Data and Building Reports in Oracle Analytics Cloud.

Set Up Jupyter Notebooks

Use the following steps to set up your Jupyter Notebooks environment.

Step 1: Set Up Your Running Environment

You can use either Anaconda or the OCI Data Sciences Service to run the Oracle-provided Notebooks. The Notebooks running/exploring user experience is almost identical in both cases.

Step 2: Download the Notebooks

  1. Save the Notebooks zip file from the Jupyter Notebooks download pageDownloads page.
  2. Unzip the file and note its content.
  3. Familiarize yourself with the basic structure of the sample Notebooks. Note the Description, Requirements and various other expandable sections.
    Graphic shows the Jupyter Description screen


    Graphic shows Jupyter Functions screen

Step 3: Install Runtime Required Components

  1. First, verify the version of Python in your environment. It must be version 3.6 or higher.
    $ python --version
    Python 3.6.13 : : Anaconda, Inc.
  2. See the instructions in the Requirements section, for each Notebook. Run the commands as shown in this section to obtain the libraries required for that particular Notebook. For example, to install "pandas" you would run the following command from a terminal (either on-premises or in a Data Science Service instance):
    $ pip install pandas
    Collecting pandas
    Downloading[…]

Step 4: Configure Your Notebooks

In order to point the Notebooks to your data you will need to edit the config.txt file. The configuration file for each deployment option (Object Store and ADW) provides different configuration parameters.

For Object Store:

  1. Out of the box, this Object Store config.txt file looks like this.
    Image shows the config.txt file.

  2. Edit the configuration file as shown. The required fields are marked below. The values are derived from the prior steps. The user, fingerprint, tenancy and region are available from your OCI account. The key_file is the path to your API key file. The bucket_name, path_to_emid and emid are the specifics for your collected data in Object Storage, as you noted it earlier. The time_range is the range of data you would like to analyze and it must be entered in the format shown.
    Note

    If the time range selected does not contain all data required to run the notebooks, it will fail. Ensure that all required data exists within the time range.
    The download_path is your choice of local storage. Here is an example:
    Image shows key highlighted values in the config.txt file.

For ADW:

  1. Out of the box, the ADW file looks like this.
    Graphic shows the ADW config file.

  2. Edit the configuration file. The following fields for ADW credentials are needed.
    • db_user = This is the warehouse database user you specified in Step 5: Create an Operations Insights Warehouse Database User.
    • db_password = This is the password for the warehouse database user you specified in Step 5: Create an Operations Insights Warehouse Database User.
    • db_name = The database name found within the tnsnames.ora file inside the wallet. It can be x_low, x_mid, or x_high
    • db_core = The user that contains #CORE in its name, where the tables are filled with data
      Graphic shows the user name with #CORE

    • lib_dir = For ADW, in order to run Jupyter Notebooks you need to download the OS version-specific client. For Windows it should be 21.3. For Mac/Linux/OCI it should be 19.15. Once downloaded, you must specify the PATH to the client. Preferably, the client should be located close to the notebooks (or even inside the directory for easier access). Place the wallet values inside the instantclient_x_x/network/admin directory.
      Graphic shows the downloaded client.

    • emid = The Enterprise Manager ID you collected earlier. See Step 1: Export EM Data to OCI.
    • time_range = The range of data you would like to analyze and it must be entered in the format shown.
      Note

      If the time range selected does not contain all data required to run the notebooks, it will fail. Ensure that all required data exists within the time range.
    Note

    The following steps are required to configure the tnsnames.ora proxy and path for sqlnet.ora. These steps are also described in the actual notebooks.
  3. Open the tnsnames.ora file (from the wallet) and insert (https_proxy=10.68.69.53)(https_proxy_port=80) within all 3 names inside the (address=1). It should look like this:
    (address=(https_proxy=10.68.69.53)(https_proxy_port=80)(protocol=tcps)...)
  4. Open the sqlnet.ora file (from the wallet) and replace the value (DIRECTORY="?/network/admin") with (DIRECTORY="$TNS_ADMIN").

Next Steps

You are now ready to review and customize the sample Jupyter Notebooks that you downloaded earlier in Step 2: Download the Notebooks. You'll be able to take full advantage of the notebooks included with this release of Jupyter Notebooks for Oracle Enterprise Manager Warehouse.

EM Warehouse Metrics per Target Type

The following tables show the metrics collected by EM Warehouse for each target type.

Database

oracle_database

Table 10-1 Configuration Metrics

Metric Name View
db_init_params CM$MGMT_DB_INIT_PARAMS_ECM
db_dbNInstanceInfo CM$MGMT_DB_DBNINSTANCEINFO_ECM
cdb_dbNInstanceInfo CM$MGMT_CDB_DBNINSTANCEINFO_ECM
cdb_init_params CM$MGMT_CDB_INIT_PARAMS_ECM

Table 10-2 Performance Metrics

Metric Name Daily Hourly
instance_efficiency y y
instance_throughput y y
memory_usage_sga_pga y y
db_inst_cpu_usage y y
wait_bottlenecks y y
db_inst_pga_alloc y y
DATABASE_SIZE y y
Database_Resource_Usage y y
archFull y y
dumpFull y y
tbspAllocation y y
wait_sess_cls y y
dataguard y y
latest_hdm_findings y y
rac_global_cache y y
topSqlMonitoringList y y
sql_response y y
memory_usage y y
topWaitEvents y y
Availability y y
AwrTimeModel y y
AwrInterconnectUsageStats y y
AwrSysstatIos y y
AwrMemoryComponents y y
AwrOsStat y y
AwrWaitClass y y
AwrSqlStat y y
AwrTimePicker y y

oracle_listener

Table 10-3 Configuration Metrics

Metric Name View
mgmt_listener_ports CM$MGMT_LISTENER_PORTS_ECM
mgmt_listener_services CM$MGMT_LISTENER_SERVICES_ECM

Table 10-4 Performance Metrics

Metric Name Daily Hourly
General Status . .
Load y y
Response . .
TNS_ERRORS y y

rac_database

Table 10-5 Configuration Metrics

Metric Name View
db_init_params CM$MGMT_DB_INIT_PARAMS_ECM
db_dbNInstanceInfo CM$MGMT_DB_DBNINSTANCEINFO_ECM
cdb_dbNInstanceInfo CM$MGMT_CDB_DBNINSTANCEINFO_ECM

Table 10-6 Performance Metrics

Metric Name Daily Hourly
wait_bottlenecks y y
DATABASE_SIZE y y
unlimitedFailedLoginAttempts y y
Availability y y
tbspAllocation y y
topWaitEvents y y
AwrTimeModel y y
AwrInterconnectUsageStats y y
AwrSysstatIos y y
AwrMemoryComponents y y
AwrOsStat y y
AwrWaitClass y y
AwrSqlStat y y
AwrTimePicker y y

oracle_pdb

Table 10-7 Configuration Metrics

Metric Name View
db_init_params CM$MGMT_PDB_INIT_PARAMS_ECM

Table 10-8 Performance Metrics

Metric Name Daily Hourly
DATABASE_SIZE . y
unlimitedFailedLoginAttempts . y

oracle_home

Table 10-9 Configuration Metrics

Metric Name View
Component CM$MGMT_LL_INV_COMPONENT
HomeInfo CM$MGMT_LL_HOME_INFO
Patch CM$MGMT_LL_INV_PATCHES
PatchFixedBug CM$MGMT_LL_INV_PATCH_BUGFIX

WebLogic

weblogic_j2eeserver

Table 10-10 Configuration Metrics

Metric Name View
Server MGMT$WEBLOGIC_SERVER
JDBCDataSource MGMT$WEBLOGIC_JDBCDATASOURCE
ResourceConfig MGMT$WEBLOGIC_RESOURCECONFIG

Table 10-11 Performance Metrics

Metric Name Daily Hourly
datasource y y
thread_pool y y
server_work_manager y y
work_manager y y
datasource_state y y
server_datasource y y
jvm_memory_usage y y
jvm_thread_contention y y
jvm_memory_pools y y
jvm_garbage_collectors y y
servlet_jsp y y
server_ejb_pool y y
server_ejb_transaction y y
jta y y
jms y y
jms_server y y
server_jms_server y y
server y y
server_health y y
jvm_threads y y
jvm y y
server_module y y
Response . .
server_servlet_jsp y y

weblogic_cluster

Table 10-12 Performance Metrics

Metric Name Daily Hourly
cluster_overview y y
work_manager y y

Exadata

oracle_exadata (Storage Server)

Table 10-13 Configuration Metrics

Metric Name View
Exadata_Cell_Config CM$EM_EXADATA_CELL
Exadata_Cell_Config_Patches CM$MGMT_ECM_NON_OUI_BUGS_FIXED
HCA_Config CM$EM_CELL_HCA_CONFIG
HCA_PortConfig CM$EM_CELL_HCA_PORT_CONFIG
Exadata_Celldisk_Config CM$EM_EXADATA_CELLDISK
Exadata_Griddisk_Config CM$EM_EXADATA_GRIDDISK
Exadata_Griddisk_Clients_Config CM$EM_EXADATA_GD_CLIENTS
Exadata_LUN_Config CM$EM_EXADATA_LUN
Exadata_LUN_PhysDisks_Config CM$EM_EXADATA_LUN_PDISKS
Exadata_Physicaldisk_Config CM$EM_EXADATA_PHYS_DISK
Exadata_Physicaldisk_Luns_Config CM$EM_EXADATA_PDISK_LUNS
Exadata_IORM_Config CM$EM_EXADATA_IORM
Exadata_IORM_DbPlan_Config CM$EM_EXADATA_IORM_DBPLAN
Exadata_IORM_CatPlan_Config CM$EM_EXADATA_IORM_CATPLAN
Exadata_Flashcache_Config CM$EM_EXADATA_FCACHE
Exadata_Flashcache_Celldisks_Config CM$XA_EXADATA_FLOG_CDISK
Exadata_Flashlog_Config CM$XA_EXADATA_FLOG
Exadata_Flashlog_Celldisks_Config CM$XA_EXADATA_FLOG_CDISK
NetworkPortsTargetComponent MGMT$SI_NET_PORTS_TGT_COMP
NetworkPortExtendedConfig MGMT$SI_NET_PORT_EXTENDED
Exadata_Databases_Metric CM$XA_CELL_DATABASES

Table 10-14 Performance Metrics

Metric Name Daily Hourly
Aggregated_HardNFlashDisk_Metric y y
Aggregated_Exadata_Capacity_Metric y y
FlashCache_Metric y y
Flash_Disk_IORM_DB_Metric y y
Flash_Disk_IORM_PDB_Metric y y
IORMDB_Metric y y
IORM_PDB_Metric y y
IORM_CONSUMER_GROUP_Metric y y
Flash_Disk_IORM_CG_Metric y y
Flash_Cache_IORM_DB_Metric y y
Flash_Cache_IORM_PDB_Metric y y
Aggregated_Exadata_Diskgroup_Capacity_Metric y y
Aggregated_Exadata_Sparse_Diskgroup_Capacity_Metric y y
Cell_Metric y y
CellDisk_Metric y y
Aggregated_CellDisk_Metric y y
SmartIO_Metric y y
HostInterConnect_Statistics y y
Filesystem_Utilization_Metric y y
Response . .
CellSrv_Status_Metric y y

Systems Infrastructure

host

Table 10-15 Configuration Metrics

Metric Name View
ECM_HW CM$MGMT_ECM_HW
ECM_HW_CPU CM$MGMT_ECM_HW_CPU
ECM_OS CM$MGMT_ECM_OS
ECM_OS_FILESYSTEM CM$MGMT_ECM_OS_FILESYSTEM
ECM_HW_NIC CM$MGMT_ECM_HW_NIC
ECM_OS_PROPERTY CM$MGMT_ECM_OS_PROPERTY

Table 10-16 Performance Metrics

Metric Name Daily Hourly
CPUUsage y y
DiagnosticsProcessTable y y
DiskActivity y y
DiskActivitySummary y y
Filesystems y y
FilesystemStatistics y y
KernelMemoryUsage y y
Load y y
MemoryUsage y y
NewCpuUsage y y
NewFilesystemsUsage y y
NewPagingActivity y y
NetworkSummary y y
PagingActivity y y
Processes y y
ProjectResourceUsage y y
Swap_Area_Status y y
TotalDiskUsage y y
UserResourceUsage y y
BufferActivity y y
Network y y
Response . .

oracle_si_server_map

Table 10-17 Configuration Metrics

Metric Name View
ComponentInfoConfigTargetComponent MGMT$SI_HW_COMP_TGT_COMP
CpuInfoConfig MGMT$SI_SVR_CPU_INFO
NetworkPortsTargetComponent MGMT$SI_NET_PORTS_TGT_COMP
SystemSummaryConfig MGMT$SI_SVR_SYSUM_CONFIG

Table 10-18 Performance Metrics

Metric Name Daily Hourly
ComponentState y y
NetworkPortPerformance y y
Response . .

oracle_ibswitch

Table 10-19 Configuration Metrics

Metric Name View
SwitchPortConfig CM$EM_IB_SWITCH_PORT_CONFIG
SwitchVersion CM$EM_IB_SWITCH_VERSION

Table 10-20 Performance Metrics

Metric Name Daily Hourly
Response , ,
SwitchPortPerformance y y

oracle_si_netswitch

Table 10-21 Configuration Metrics

Metric Name View
ComponentInfoConfigTargetComponent MGMT$SI_HW_COMP_TGT_COMP
ExtendedIBSwitchConfig MGMT$SI_EXT_IB_SWITCH
NetworkPortsTargetComponent MGMT$SI_NET_PORTS_TGT_COMP
SwitchConfig MGMT$SI_SWITCH_CONFIG

Table 10-22 Performance Metrics

Metric Name Daily Hourly
ComponentState y y
NetworkPortPerformance y y
Response . .

oracle_si_virtual_server

Table 10-23 Configuration Metrics

Metric Name View
VI_NM_VP_PROPERTY_CFG MGMT$VI_NM_VP_PROPERTY_CFG
VI_NM_OSV_NET_CFG MGMT$VI_NM_OSV_NET_CFG
VI_DM_OSV_CFG_DETAILS MGMT$VI_DM_OSV_CFG_DETAILS
VI_DM_OSP_CFG_DETAILS MGMT$VI_DM_OSP_CFG_DETAILS
VI_DM_OSV_NET_CFG MGMT$VI_DM_OSV_NET_CFG
VI_DM_OSV_SOFTWARE_CFG MGMT$VI_DM_OSV_SOFTWARE_CFG
VI_DM_OSV_VCPU_CFG MGMT$VI_DM_OSV_VCPU_CFG
VI_DM_OSV_VIRTUAL_DISKS MGMT$VI_DM_OSV_VIRTUAL_DISKS
VI_NM_OSV_ATTRIBUTE MGMT$VI_NM_OSV_ATTRIBUTE
VI_NM_OSV_CFG_DETAILS MGMT$VI_NM_OSV_CFG_DETAILS
VI_NM_OSV_SNAPSHOT_CFG MGMT$VI_NM_OSV_SNAPSHOT_CFG
VI_NM_OSV_SSHKEYS_CFG MGMT$VI_NM_OSV_SSHKEYS_CFG
VI_NM_OSV_STORAGE_CFG MGMT$VI_NM_OSV_STORAGE_CFG
VI_NM_OSV_VCABLE_CFG MGMT$VI_NM_OSV_VCABLE_CFG
VI_NM_VNIC_CFG_DETAILS MGMT$VI_NM_VNIC_CFG_DETAILS

Table 10-24 Performance Metrics

Metric Name Daily Hourly
VirtualServer_Load y y
VirtualServer_NetworkActivity_Summary y y
VirtualServer_DiskActivity y y
VirtualServer_DiskActivity_Summary y y
VirtualServer_External_Storage_Activity y y
VirtualServer_NetworkActivity y y
VirtualServer_VcpuDetails y y
server y y
server_module y y
server_ejb_transaction y Y

oracle_si_virtual_platform

Table 10-25 Configuration Metrics

Metric Name View
VI_DM_VP_OSV_ASSOCS MGMT$VI_DM_VP_OSV_ASSOCS
VI_DM_VP_CFG_DETAILS MGMT$VI_DM_VP_CFG_DETAILS
VI_DM_VP_FS_CFG MGMT$VI_DM_VP_FS_CFG
VI_DM_VP_NET_CFG MGMT$VI_DM_VP_NET_CFG
VI_DM_VP_OS_SW MGMT$VI_DM_VP_OS_SW
VI_NM_VP_CFG_DETAILS MGMT$VI_NM_VP_CFG_DETAILS
VI_NM_VP_NET_CFG MGMT$VI_NM_VP_NET_CFG
VI_NM_VP_OSV_ASSOCS MGMT$VI_NM_VP_OSV_ASSOCS
VI_NM_VP_PROPERTY_CFG MGMT$VI_NM_VP_PROPERTY_CFG

Table 10-26 Performance Metrics

Metric Name Daily Hourly
VirtualPlatform_Load y y
VirtualPlatform_NetworkActivity y y
FileSystem y y
LoadDomZero y y
PagingActivity y y
ProcessStatistics y y
ProgramResourceUtilization y y
SwapArea y y
VirtualPlatform_CpuInterrupts y y
VirtualPlatform_DiskUtilization y y
VirtualPlatform_DiskActivity y y
VirtualPlatform_DiskActivity_Summary y y
VirtualPlatform_FileSystem_Summary y y
VirtualPlatform_LoadDomZero y y
VirtualPlatform_NetworkActivity_Summary y y
VirtualPlatform_NetworkError y y

oracle_si_server

Table 10-27 Configuration Metrics

Metric Name View
VI_DM_OSP_CFG_DETAILS MGMT$VI_DM_OSP_CFG_DETAILS

oracle_vm_server

Table 10-28 Configuration Metrics

Metric Name View
ServerConfigHW CM$VT_VS_HW_CFG
Repositories CM$VT_VS_REPOS
ServerAttributes CM$VT_VS_ATTRIBUTES
Abilities CM$VT_VS_ABILITIES
FileServers CM$VT_VS_FILESERVERS
FilesystemMounts CM$VT_VS_FS_MOUNTS
Hypervisor CM$VT_VS_HYPERVISOR
NetworkPorts CM$VT_VS_NET_DEVICE
ServerConfigSW CM$VT_VS_SW_CFG
Processors CM$VT_VS_PROCESSORS

Table 10-29 Performance Metrics

Metric Name Daily Hourly
OVMServer_DiskActivity y y
OVMServer_NetworkActivity y y
OVMServer_VlanActivity y y
OVMServer_Load y y
OVMServer_Filesystems y y
OracleVMServer_Data y y
OVMServer_DiskActivity_Summary y y
OVMServer_Filesystems_Summary y y
OVMServer_NetworkActivity_Summary y y

oracle_vm_guest

Table 10-30 Configuration Metrics

Metric Name View
VirtualMachineConfig CM$VT_VM_CONFIG
EMCfg CM$VT_VM_EM_CFG
ExalogicControlVServerTags CM$VT_EXA_CONTROL_VSERVER_TAGS
PhysicalDisks CM$VT_VM_PDISKS
PhysicalDisks_QOS CM$VT_VM_PDISK_QOS
VirtualDisks CM$VT_VM_VDISKS
VirtualDisks_QOS CM$VT_VM_VDISK_QOS
VirtualMachineConfigSW CM$VT_VM_SW_CFG
VirtualNIC CM$VT_VM_VNIC
VirtualNIC_QOS CM$VT_VM_VNIC_QOS

Table 10-31 Performance Metrics

Metric Name Daily Hourly
OVMGuestLoad y y
OVMGuest_Filesystems y y
OracleVMGuest_Data y y
OVMGuest_DiskActivity y y
OVMGuest_DiskActivity_Summary y y
OVMGuest_Filesystems_Summary y y
OVMGuest_Load y y
OVMGuest_NetworkActivity y y
OVMGuest_NetworkActivity_Summary y y

osm_cluster

Table 10-32 Configuration Metrics

Metric Name View dw.json opsi.json
asm_init_params CM$MGMT_ASM_INIT_PARAMS_ECM X X
asm_diskgroup CM$MGMT_ASM_DISKGROUP_ECM X X
asm_disk CM$MGMT_ASM_DISK_ECM X X
asm_disk_sparse CM$MGMT_ASM_SPARSE_DISK_ECM X X

Table 10-33 Performance Metrics

Metric Name Daily Hourly
DiskGroup_Usage y y
DiskGroup_Usage_Sparse y y
Database_DiskGroup_Usage y y
PDB_DiskGroup_Usage y y
Database_DiskGroup_Usage_Sparse y y
PDB_DiskGroup_Usage_Sparse y y
Instance_Diskgroup_Performance y y
Instance_Diskgroup_Database_Performance y y
Volumes_Summary y y
ACFS_State y y
Response . .

osm_instance

Table 10-34 Configuration Metrics

Metric Name View
asm_instance_config CM$MGMT_ASM_INSTANCE_ECM
asm_init_params CM$MGMT_ASM_INIT_PARAMS_ECM
asm_clients_config CM$MGMT_ASM_CLIENT_ECM
asm_diskgroup CM$MGMT_ASM_DISKGROUP_ECM
asm_disk CM$MGMT_ASM_DISK_ECM
asm_disk_sparse CM$MGMT_ASM_SPARSE_DISK_ECM

Table 10-35 Performance Metrics

Metric Name Daily Hourly
DiskGroup_Usage y y
DiskGroup_Usage_Sparse y y
Database_DiskGroup_Usage y y
PDB_DiskGroup_Usage y y
Database_DiskGroup_Usage_Sparse y y
PDB_DiskGroup_Usage_Sparse y y
Instance_Diskgroup_Performance y y
Instance_Diskgroup_Database_Performance y y
Volumes_Summary y y
ACFS_State y y
Response . .

oracle_vm_server_pool

Table 10-36 Configuration Metrics

Metric Name View
OVMServerPoolBasicConfig CM$VT_VSP_CONFIG

Table 10-37 Performance Metrics

Metric Name Daily Hourly
Load y y
OVMGuestLoad y y
OVMServer_Load y y
OVMGuest_Filesystems y y
OVMServer_Filesystems y y
OVMGuest_Filesystems_Summary y y
OVMGuest_NetworkActivity y y
OVMGuest_NetworkActivity_Summary y y
OVMServer_DiskActivity y y
OVMServer_DiskActivity_Summary y y
OVMServer_Filesystems_Summary y y
OVMServer_NetworkActivity y y
OVMServer_VlanActivity y y
OracleVMServerPool_Data y y

oracle_vt_olv_guest

Table 10-38 Configuration Metrics

Metric Name View
OLVGuestConfig MGMT$VT_OLV_GUEST_CONFIG
OLVGuestSWConfig MGMT$VT_OLV_GUEST_SW_CONFIG
OLVGuest_DiskConfiguration MGMT$VT_OLV_VM_DISK
OLVGuest_NetworkConfiguration MGMT$VT_OLV_VM_VNIC

Table 10-39 Performance Metrics

Metric Name Daily Hourly
OLVGuest_CPU y y
OLGuest_Memory y y
OLVGuest_DiskActivity y y
OLVGuest_DiskActivity_Summary y y
OLVGuest_NetworkActivity y y
OLVGuest_NetworkActivity_Summary y y

oracle_vt_olv_server

Table 10-40 Configuration Metrics

Metric Name View
OLVServerHWConfig MGMT$VT_OLV_SERVER_HW_CONFIG
OLVServerBasicConfig MGMT$VT_OLV_SERVER_CONFIG
OLVServerSWConfig MGMT$VT_OLV_SERVER_SW_CONFIG
OLVServer_NetworkConfiguration MGMT$VT_OLV_SERVER_VNIC

Table 10-41 Performance Metrics

Metric Name Daily Hourly
OLVServer_Load y y
OLVServer_NetworkActivity y y
OLVServer_NetworkActivity_Summary y y

oracle_vt_olv_cluster

Table 10-42 Configuration Metrics

Metric Name View
OLVClusterBasicConfig MGMT$VT_OLV_CLUSTER_CONFIG

Table 10-43 Performance Metrics

Metric Name Daily Hourly
OLVCluster_Load y y
OlvCluster_Data y y

oracle_vm_manager

Table 10-44 Configuration Metrics

Metric Name View
OracleVM_Data CM$VT_OVMM_CONFIG

Table 10-45 Performance Metrics

Metric Name Daily Hourly
ManagerConfig y y

oracle_vm_zone

Table 10-46 Configuration Metrics

Metric Name View
BasicConfig CM$VT_ZONE_CONFIG

Table 10-47 Performance Metrics

Metric Name Daily Hourly
Load y y
OracleVMZone_Data y y

oracle_vt_olv_manager

Table 10-48 Configuration Metrics

Metric Name View
OLVManagerConfig MGMT$VT_OLV_MANAGER_CONFIG

Table 10-49 Performance Metrics

Metric Name Daily Hourly
OlvManager_Data y y

oracle_vt_olv_datacenter

Table 10-50 Configuration Metrics

Metric Name View
OLVDatacenterBasicConfig MGMT$VT_OLV_DATACENTER_CONFIG

Table 10-51 Performance Metrics

Metric Name Daily Hourly
OlvDatacenter_Data y y
OLVDatacenter_Load y y