Identify the Top Resource Consuming Exadata Systems
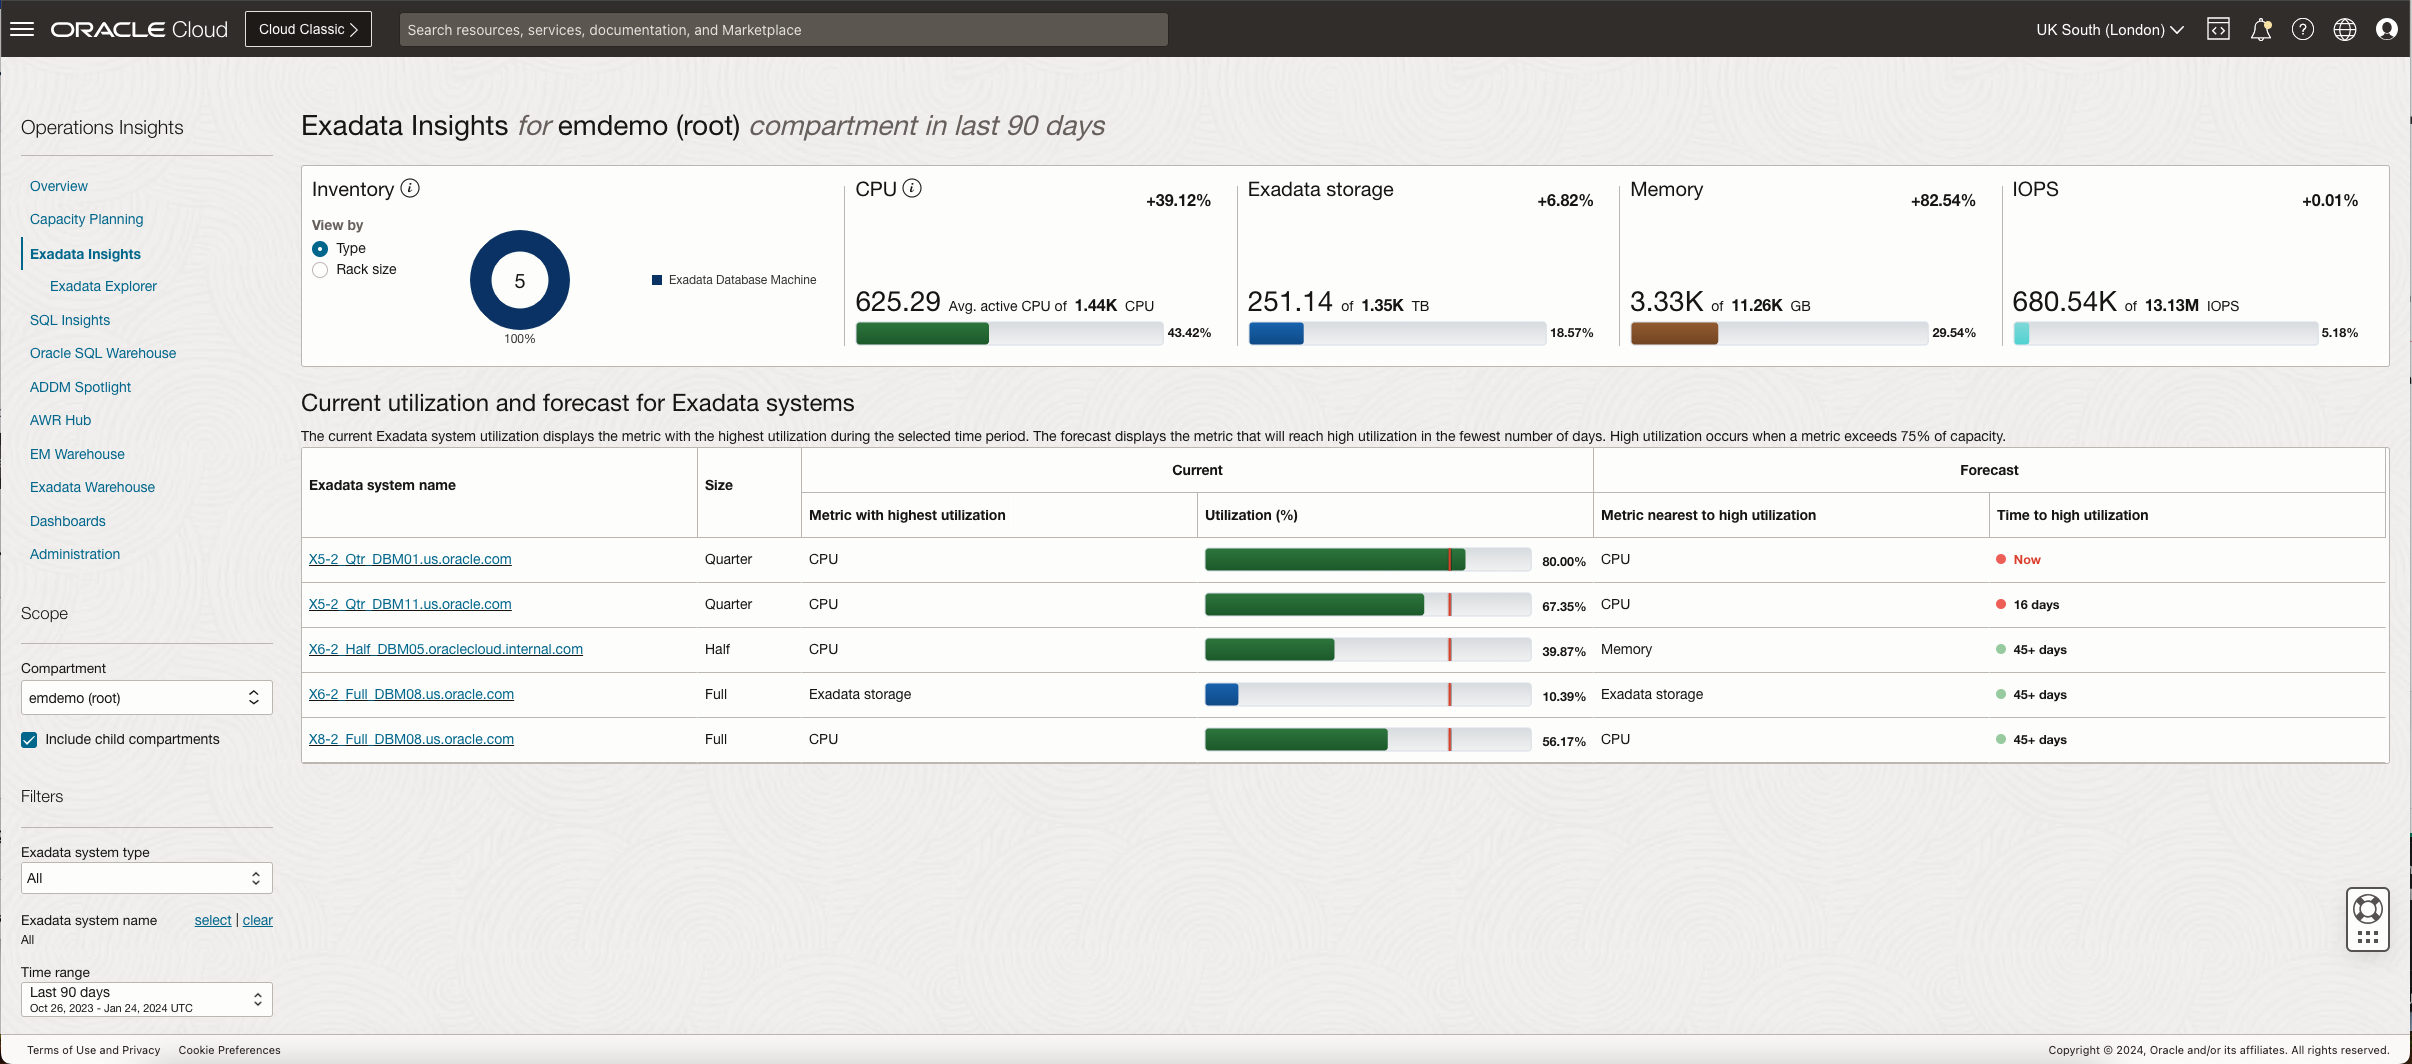
To get a unified view of your enterprise-wide resource utilization and performance of Exadata Database Machine systems from the Ops Insights main menu, click Exadata Insights to display the fleet-wide Exadata System Capacity Planning dashboard.
The lower left portion of the Exadata Insights screen allows for Scope refinement, select the Compartment you wish to review and checkmark Include child compartments if you require to view all Exadata inventory within a compartment and its child compartments. Filters allows you to set what type of Exadata system you wish to view.
The Exadata System Capacity Planning dashboard, lets you view the global Exadata System Inventory, resource utilization by CPU, Exadata Storage, Memory, and Input/Output Per Second (IOPS) for all Exadata Systems. You can also compare current and forecasted resource usage between Exadata Systems, and identify which systems could potentially run into problems due to current high utilization, or may run into problems in the future per forecasted high utilization.
The Current Utilization and Forecast for Exadata Systems table provides a quick view into which systems need immediate attention. The table shows you highest resource utilization metric for each Exadata System and, if not already exceeded, when the high utilization threshold (above 75%) will be exceeded in the near future. For further analysis, you can drill down into individual Exadata Systems for a detailed look at system resources.
To further personalize service configurations, including creating custom tag filters, see: Service Configurations.
Figure 5-1 Graphic shows the Exadata Insights home dashboard screen
