Cluster Trace Data
You can create clusters using the Trace Explorer Query Language (TQL) when working with queries to cluster spans by attributes.
Cluster Queries
The Trace Explorer Query Language (TQL) supports creating cluster queries which allow to cluster traces or spans by attributes, and identify outliers. They can be executed by using the CLUSTER BY command.
Supported Attribute Types
The attribute types can be metrics or dimensions.
- Metric: numeric values including Time (epoch)
- Dimension: string values
Cluster queries support a maximum of 6 attributes.
Syntax
CLUSTER BY <TQL query>A TQL query is a query with attributes and data to cluster by. It can be any query including nested queries. For information about queries and syntax, see Work with Queries in Trace Explorer.
-
CLUSTER BY traceduration, errorcountThe above example queries the attributes: traceduration and errorcount from all the traces. Note it's not using the show traces clause since it's optional and TQL adds it by default.
-
CLUSTER BY show traces traceduration, host where ServiceName = 'Service1'The above example uses the show traces clause explicitly to query the attributes: traceduration and host from all the traces where ServiceName is equal to Service1.
Results
The result is the data in a table format with the following columns:
Table 5-1 Cluster By Command Results
| Name | Type | Description |
|---|---|---|
| Cluster ID | Numeric | Cluster identifier |
| Count | Numeric | Number of spans or traces in that cluster |
| Percentage | Numeric | Percentage of spans or traces in that cluster |
| Outlier | String | True or False
Whether or not that cluster is an outlier |
| Dimension(s)
(Only if dimensions are part of the cluster query) |
String | Dimension name
Single value per dimension |
| Metric(s)_min
(Only if metrics are part of the cluster query) |
Numeric | Metric minimum value |
| Metric(s)_max
(Only if metrics are part of the cluster query) |
Numeric | Metric maximum value |
| Metric(s)_center
(Only if metrics are part of the cluster query) |
Numeric | Metric center value |
Examples
Example 1:
CLUSTER BY show traces traceduration
The above example queries the attribute: traceduration from all the spans. Note it's using the show traces clause explicitly.
Example 2:
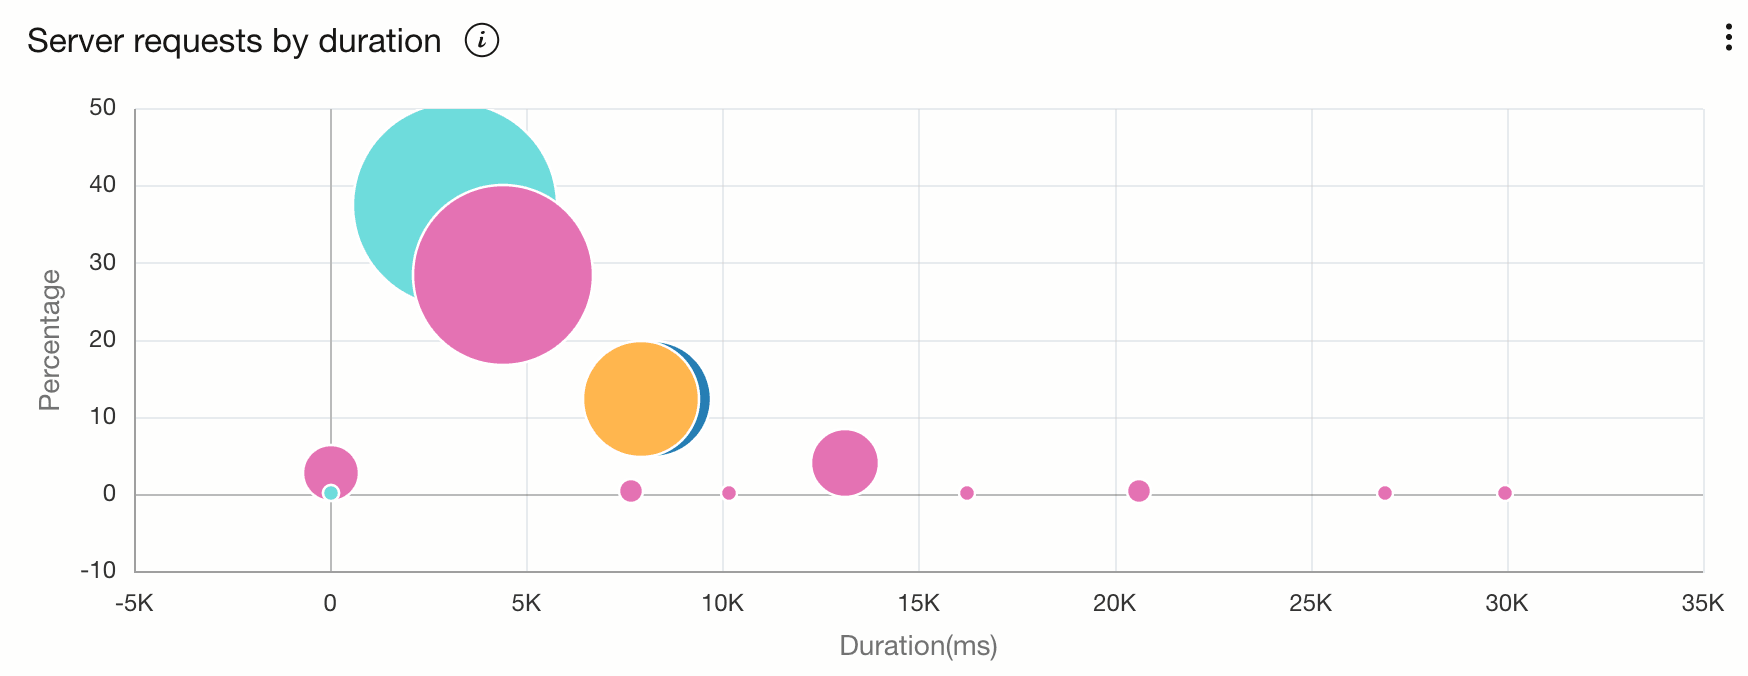
CLUSTER BY show spans spanDuration, OperationName as ServerRequest where kind='SERVER'The above example queries the attributes: spanDuration and OperationName from all the spans where kind is equal to SERVER.
For visualization, you can generate a bubble chart using the trace data widget builder. For information, see Create a Query-based Widget Using Traces in the Management Dashboard documentation. 
- Empty values are dropped from the clustering data. Use the
omittedTofunction to assign an empty value. - No more than 1 million data records can be clustered at a time.
- If there are more than 300 clusters, top 300 clusters are returned.