Selecting a Nondefault Time Range for a Query
Set the bounds, or timestamps, of the metric data that you want returned from a query of metric data in Monitoring.
Considerations
Available options for time range depend on interval and resolution.
The maximum time range returned for a metric query depends on the resolution. By default, for metric queries, the resolution is the same as the query interval.
The maximum time range is calculated using the current time, regardless of any specified end time. Following are the maximum time ranges returned for each interval selection available in the Console (Basic mode).
| Interval | Default resolution (metric queries) | Maximum time range returned |
|---|---|---|
|
1 minute Auto (Service Metrics page)*, when the selected period of time is 6 hours or less |
1 minute | 7 days |
|
5 minutes Auto (Service Metrics page)*, when the selected period of time is more than 6 hours and less than 36 hours |
5 minutes | 30 days |
|
1 hour Auto (Service Metrics page)*, when the selected period of time is more than 36 hours |
1 hour | 90 days |
|
1 day |
1 day | 90 days |
* The maximum time range returned when you select Auto for Interval (Service Metrics page only) is determined by the automatic interval selection. The automatic interval selection is based on the selected period of time.
To specify a nondefault resolution that differs from the interval, see Selecting a Nondefault Resolution for a Query.
- Example 1 for Returned Data
- One-minute interval and resolution up to the current time, sent at 10:00 on January 8. No resolution or end time is specified, so the resolution defaults to the interval value of
1m, and the end time defaults to the current time (2023-01-08T10:00:00.789Z). This request returns a maximum of 7 days of metric data points. The earliest data point possible within this seven-day period would be 10:00 on January 1 (2023-01-01T10:00:00.789Z). - Example 2 for Returned Data
- Five-minute interval with one-minute resolution up to two days ago, sent at 10:00 on January 8. Because the resolution drives the maximum time range, a maximum of 7 days of metric data points is returned. While the end time specified was 10:00 on January 6 (
2023-01-06T10:00:00.789Z), the earliest data point possible within this seven-day period would be 10:00 on January 1 (2023-01-01T10:00:00.789Z). Therefore, only 5 days of metric data points can be returned in this example.
By default, charts show the last hour of metric data. For information about time range on default charts, see Changing the Time Range for Default Metric Charts. (Time range isn't available for the metric chart displayed while creating or editing an alarm.)
-
Select a period of time from Quick selects.
Example of chart for Last hour:

Example of chart for Last 6 hours:

-
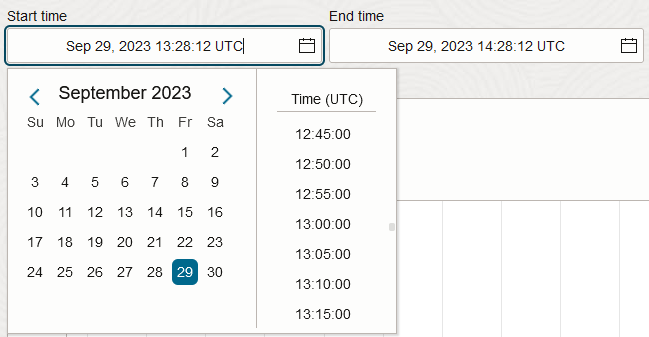
To specify the start or end of a period time, enter a value in Start time or End time and then type a value.
You can also select the date and time from the provided calendar tool.
-
Select a period of time from Quick selects.
- Note
The default time range for CLI and API is the last three hours.Use the oci monitoring metric-data summarize-metrics-data command and required parameters to query metric data. Use the
--start-timeand--end-timeparameters to select a nondefault time range for the query.oci monitoring metric-data summarize-metrics-data --start-time <time_rfc3339_format> --end-time <time_rfc3339_format> [...]Example value for start or end time:
2023-09-29T13:58:00.000ZFor a complete list of parameters and values for CLI commands, see the Command Line Reference for Monitoring.
- Note
The default time range for CLI and API is the last three hours.Run the SummarizeMetricsData operation to query metric data. Use the
startTimeandendTimeattributes to select a nondefault time range for the query. For an example, see SummarizeMetricsDataDetails.