Creating a Connector

Create a connector in Connector Hub.

Note

To avoid automatic deactivation by Oracle Cloud Infrastructure, validate that the connector successfully moves data by checking for expected results at the target service and optionally enable logs.

This page shows general instructions for creating a connector.

The following pages provide source-specific instructions:

To review supported queries for filtering source logs, see Log Query Reference for Connector Hub.

    1. Open the navigation menu and click Analytics & AI. Under Messaging, click Connector Hub.
    2. On the Connectors page, select a compartment.
    3. Click Create connector.
    4. On the Create connector page, enter a user-friendly name for the new connector and an optional description. Avoid entering confidential information.
    5. Select the compartment where you want to store the new connector.
    6. Select the Source service that contains the data that you want to transfer:
      • Logging: Transfer log data from the Logging service. See Logging.
      • Monitoring: Transfer metric data points from the Monitoring service. See Monitoring.
      • Queue: Transfer messages from a queue in the service. See Queue.
      • Streaming: Transfer stream data from the Streaming service. See Streaming.
    7. For Target, select the service that you want to transfer the data to:
      • Functions: Send data to a function.
      • Logging Analytics: Send data to a log group.
      • Monitoring: Send metric data points to the Monitoring service.
      • Notifications: Send data to a topic.
      • Object Storage: Send data to a bucket.
      • Streaming: Send data to a stream.
    8. (Optional) To enable service logs for the new connector, click the Logs switch and provide the following values:
      • Log category: The value Connector Tracking is automatically selected.
      • Compartment: Select the compartment that you want for storing the service logs for the connector.
      • Log group: Select the log group that you want for storing the service logs. To create a new log group, click Create new group and then enter a name.
      • Log name: Optionally enter a name for the log.
      • Show advanced options:
        • Log retention: Optionally specify how long to keep the service logs (default: 30 days).
    9. Under Configure source connection, enter values for the selected source.
      Logging
      • Compartment name: The compartment that contains the log that you want.
      • Log group: The log group that contains the log that you want.

        For log input schema, see LogEntry.

      • Logs: The log that you want. To filter the logs that appear in this field, see the next step.
      Monitoring
      • Metric compartment: Select the compartment that contains the metrics that you want.
      • Namespaces: Select one or more metric namespaces that include the metrics that you want. All metrics in the selected namespaces are retrieved.

        The namespaces must begin with "oci_". Example: oci_computeagent.

      • To add metric namespaces from another compartment, click + Another compartment.

        The maximum number of metric compartments per Monitoring source is 5. The maximum number of namespaces per Monitoring source (across all metric compartments) is 50. Following are example sets of compartments in a single source that remain within this maximum:

        • 5 metric compartments with 10 namespaces each
        • 3 metric compartments with varying numbers of namespaces (20, 20, 10)
        • 1 metric compartment with 50 namespaces
      Queue
      • Compartment: Select the compartment that contains the queue that you want.
      • Queue: Select the queue that contains the messages that you want.
      • Channel Filter (under Message filtering) (optional): To filter messages from channels in the queue, enter a value.

        For example, to filter messages by channel ID, enter the channel ID.

        For supported values, see channelFilter at GetMessages (Queue API).

      Note

      A message that has been transferred to the connector's target is considered "consumed." To meet requirements of the Queue service, the connector deletes transferred messages from the source queue. For more information, see Consuming Messages.
      Streaming
      • Compartment: Select the compartment that contains the stream that you want.
      • Stream pool: Select the stream pool that contains the stream that you want.

        Private endpoint configuration isn't supported. For stream pool configuration details, see Creating Stream Pools.

      • Stream: Select the name of the stream that you want to receive data from.
      • Read position: Specify the cursor position from which to start reading the stream.
        • Latest: Starts reading messages published after creating the connector.
          • If the first run of a new connector with this configuration is successful, then it moves data from the connector's creation time. If the first run fails (such as with missing policies), then after resolution the connector either moves data from the connector's creation time or, if the creation time is outside the retention period, the oldest available data in the stream. For example, consider a connector created at 10 a.m. for a stream with a two-hour retention period. If failed runs are resolved at 11 a.m., then the connector moves data from 10 a.m. If failed runs are resolved at 1 p.m., then the connector moves the oldest available data in the stream.
          • Later runs move data from the next position in the stream. If a later run fails, then after resolution the connector moves data from the next position in the stream or the oldest available data in the stream, depending on the stream's retention period.
        • Trim Horizon: Starts reading from the oldest available message in the stream.
          • If the first run of a new connector with this configuration is successful, then it moves data from the oldest available data in the stream. If the first run fails (such as with missing policies), then after resolution the connector moves the oldest available data in the stream, regardless of the stream's retention period.
          • Later runs move data from the next position in the stream. If a later run fails, then after resolution the connector moves data from the next position in the stream or the oldest available data in the stream, depending on the stream's retention period.
    10. (Optional) Under Log filter task (available for Logging source), enter values to filter the logs.

      To specify attribute values for audit logs (_Audit):

      • Filter type: Select Attribute.
      • Attribute name: Select the audit log attribute that you want.
      • Attribute values: Specify values for the selected audit log attribute.

      To specify events for audit logs (_Audit):

      • Filter type: Select Event type.
      • Service name: Select the service that contains the event that you want.
      • Event type: Select the event that you want.

      To specify property values for service logs or custom logs (not _Audit):

      • Property: Select the property that you want.
      • Operator: Select the operator to use for filtering property values.
      • Value: Specify the property value that you want.

      To review supported queries for filtering source logs, see Log Query Reference for Connector Hub.

    11. (Optional) Under Configure function task, configure a function task to process data from the source using the Functions service:
      • Select task: Select Function.
      • Compartment: Select the compartment that contains the function that you want.
      • Function application: Select the name of the function application that includes the function you want.
      • Function: Select the name of the function that you want to use to process the data received from the source.

        For use by the connector as a task, the function must be configured to return one of the following responses:

        • List of JSON entries (must set the response header Content-Type=application/json)
        • Single JSON entry (must set the response header Content-Type=application/json)
        • Single binary object (must set the response header Content-Type=application/octet-stream)
      • Show additional options: Click this link and specify limits for each batch of data sent to the function. If you choose to use manual settings, provide values for batch size limit (KBs) and batch time limit (seconds).

      Considerations for function tasks:

      • Connector Hub doesn't parse the output of the function task. The output of the function task is written as-is to the target. For example, when using a Notifications target with a function task, all messages are sent as raw JSON blobs.
      • Functions are invoked synchronously with 6 MB of data per invocation. If data exceeds 6 MB, then the connector invokes the function again to move the data that's over the limit. Such invocations are handled sequentially.
      • Functions can execute for up to five minutes.
      • Function tasks are limited to scalar functions.
    12. If you selected Functions as the target, under Configure target, configure the function to send the log data to. Then, skip to step 17.
      • Compartment: Select the compartment that contains the function that you want.
      • Function application: Select the name of the function application that contains the function that you want.
      • Function: Select the name of the function that you want to send the data to.
      • Show additional options: Click this link and specify limits for each batch of data sent to the function. If you choose to use manual settings, provide values for batch size limit (either KBs or number of messages) and batch time limit (seconds).

        For example, limit batch size by selecting either 5,000 kilobytes or 10 messages. An example batch time limit is 5 seconds.

      Considerations for Functions targets:

      • The connector flushes source data as a JSON list in batches. Maximum batch, or payload, size is 6 MB.
      • Functions are invoked synchronously with 6 MB of data per invocation. If data exceeds 6 MB, then the connector invokes the function again to move the data that's over the limit. Such invocations are handled sequentially.
      • Functions can execute for up to five minutes.
      • Don't return data from Functions targets to connectors. Connector Hub doesn't read data returned from Functions targets.
    13. If you selected Logging Analytics as the target, under Configure target, configure the log group to send the log data to. Then, skip to step 17.
      • Compartment: Select the compartment that contains the log group that you want.
      • Log group: Select the log group that you want.
      • Log source identifier (for Streaming source only): Select the log source.
    14. If you selected Monitoring as the target, under Configure target, configure the metric to send the log data to. Then, skip to step 17.
      • Compartment: Select the compartment that contains the metric that you want.
      • Metric namespace: Select the metric namespaces that includes the metric that you want. You can select an existing namespace or enter a new namespace.

        When typing a new namespace, press Enter to submit it.

        For a new metric namespace, don't use the reserved oci_ prefix. Metrics aren't ingested when reserved prefixes are used. See Publishing Custom Metrics and PostMetricData Reference (API).

      • Metric: Select the name of the metric that you want to send the data to. You can select an existing metric or enter a new metric.

        When typing a new metric name, press Enter to submit it.

        For a new metric, don't use the reserved oci_ prefix. Metrics aren't ingested when reserved prefixes are used. See Publishing Custom Metrics and PostMetricData Reference (API).

      • Add dimensions: Click this button to optionally configure dimensions. The Add dimensions panel opens.

        The six latest rows of log data are retrieved from the log specified under Configure source.

        Specify a name-value key pair for each dimension that you want to send data to. The name can be custom and the value can be either static or a path to evaluate. Use dimensions to filter the data after the log data is moved to a metric. For an example dimension use case, see Scenario: Creating Dimensions for a Monitoring Target.

        To extract data (path value)
        1. Under Select path, click the down-arrow for the log that you want.

          Paths are listed for the expanded log.

        2. Select the check box for the path that you want.

          The following image shows an example of a selected path (bucketName) and an unselected path (eTag):

          Selected and unselected paths

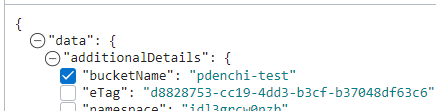
          Under Edit path, the Dimension name and Value fields are automatically populated from the selected path.

          If no log data is available, then you can manually enter a path value with a custom dimension name under Edit path. The path must start with logContent, using either dot (.) or index ([]) notation. Dot and index are the only supported JMESPath selectors. For example:
          • logContent.data (dot notation)
          • logContent.data[0].content (index notation)

          For more information about valid path notation, see JmesPathDimensionValue.

        3. Optionally, edit the dimension name.

        To tag data (static value)

        • Under Static values, click + Another static value and then enter a dimension name and value. For example, enter traffic and customer.

      Note

      For new (custom) metrics, the specified metric namespace and metric are created the first time that the connector moves data from the source to the Monitoring service. To check for the existence of moved data, query the new metric by using the Console, CLI, or API. See Creating a Query for a Custom Metric.

      What's included with the metric

      In addition to any dimension name-value key pairs that you specify under Configure dimensions, the following dimensions are included with the metric:
      • connectorId: The OCID of the connector that the metrics apply to.
      • connectorName: The name of the connector that the metrics apply to.
      • connectorSourceType: The source service that the metrics apply to.

      The timestamp of each metric data point is the timestamp of the corresponding log message.

    15. If you selected Notifications as the target, under Configure target, configure the topic to send the log data to. Then, skip to step 17.
      • Compartment: Select the compartment that contains the topic that you want.
      • Topic: Select the name of the topic that you want to send the data to.
      • Message format: Select the option that you want:
        Note

        Message format options are available for connectors with Logging source only. These options aren't available for connectors with function tasks. When Message format options aren't available, messages are sent as raw JSON blobs.
        • Send formatted messages: Simplified, user-friendly layout.

          To view supported subscription protocols and message types for formatted messages, see Friendly Formatting.

        • Send raw messages: Raw JSON blob.

      Considerations for Notifications targets:

      • The maximum message size for the Notifications target is 128 KB. Any message that exceeds the maximum size is dropped.
      • SMS messages exhibit unexpected results for certain connector configurations. This issue is limited to topics that contain SMS subscriptions for the indicated connector configurations. For more information, see Multiple SMS messages for a single notification.
    16. If you selected Object Storage as the target, under Configure target, configure the bucket to send the log data to. Then, skip to step 17.
      • Compartment: Select the compartment that contains the bucket that you want.
      • Bucket: Select the name of the bucket that you want to send the data to.
      • Object Name Prefix: Optionally enter a prefix value.
      • Show additional options: Click this link and optionally enter values for batch size (in MBs) and batch time (in milliseconds).

      Considerations for Object Storage targets:

      • Batch rollover details:

        • Batch rollover size: 100 MB
        • Batch rollover time: 7 minutes
      • Files saved to Object Storage are compressed using gzip.

      • Format of data moved from a Monitoring source: Objects. The connector partitions source data from Monitoring by metric namespace and writes the data for each group (namespace) to an object. Each object name includes the following elements.

        <object_name_prefix>/<service_connector_ocid>/<metric_compartment_ocid>/<metric_namespace>/<data_start_timestamp>_<data_end_timestamp>.<sequence_number>.<file_type>.gz

        Within an object, each set of data points is appended to a new line.

    17. If you selected Streaming as the target, under Configure target, configure the stream to send the log data to.
      • Compartment: Select the compartment that contains the stream that you want.
      • Stream: Select the name of the stream that you want to send the data to.

      Considerations for Streaming targets:

      • Private endpoint configuration isn't supported. For stream pool configuration details, see Creating Stream Pools.
      • Format of data moved from a Monitoring source: Each object is written as a separate message.
    18. To accept default policies, click the Create link provided for each default policy.

      Default policies are offered for any authorization required for this connector to access source, task, and target services.

      You can get this authorization through these default policies or through group-based policies. The default policies are offered whenever you use the Console to create or edit a connector. The only exception is when the exact policy already exists in IAM, in which case the default policy isn't offered. For more information about this authorization requirement, see Authentication and Authorization.

      • If you don't have permissions to accept default policies, contact your administrator.
      • Automatically created policies remain when connectors are deleted. As a best practice, delete associated policies when deleting the connector.

      To review a newly created policy, click the associated view link.

    19. (Optional) Assign tags to the connector. Click Show advanced options and then provide values for the tagging fields.
      • Tag namespace: To add a defined tag, select an existing namespace. If adding a free-from tag, leave blank.
      • Tag key: To add a defined tag, select an existing tag key. To add a free-form tag, type the key name that you want.
      • Tag value: Type the tag value that you want.
      • Add tag: Click to add another tag.
    20. Click Create.
  • Use the oci sch service-connector create command and required parameters to create a connector:

    oci sch service-connector create --display-name "<display_name>" --compartment-id <compartment_OCID> --source [<source_in_JSON>] --target [<target_in_JSON>]

    For a complete list of parameters and values for CLI commands, see the CLI Command Reference.

  • Run the CreateServiceConnector operation to create a connector.

Confirm That the New Connector Moves Data

After you create the connector, confirm that it's moving data.

  • Enable logs for the connector to get details on data flow.
  • Check for expected results at the target service.

Confirming that data is moved helps you avoid automatic deactivation, which happens when a connector fails for a long time.