Creating Reports
A single report you generate analyzes an AV based on the Levels and measures you select.
- Open the Analysis for editing from the Data Analysis home page. Select Edit from the Analysis tile you wish to edit.
- Click on the + Report icon to add one or more reports to the Analysis. You can use a report to add configured Analyses to the Analyses page.
- Click on the report to select it. The resize arrow in the report resizes the report window.
- Click the cross icon on the selected report to delete the report from the Analysis.
- The header displays the name of the Analytic View you select.
- You can expand or collapse the report with their respective arrows.
- Edit SQL
- Performance
- Rename Report: Click Rename Report to rename it. Click Save Report to save the current report.
- Delete Report: Click Delete Report to delete the report.
You can view the SQL output when you click Edit SQL. The lower right pane in SQL displays the output of the operation executed in the SQL editor. The following figure shows the output pane on the SQL page.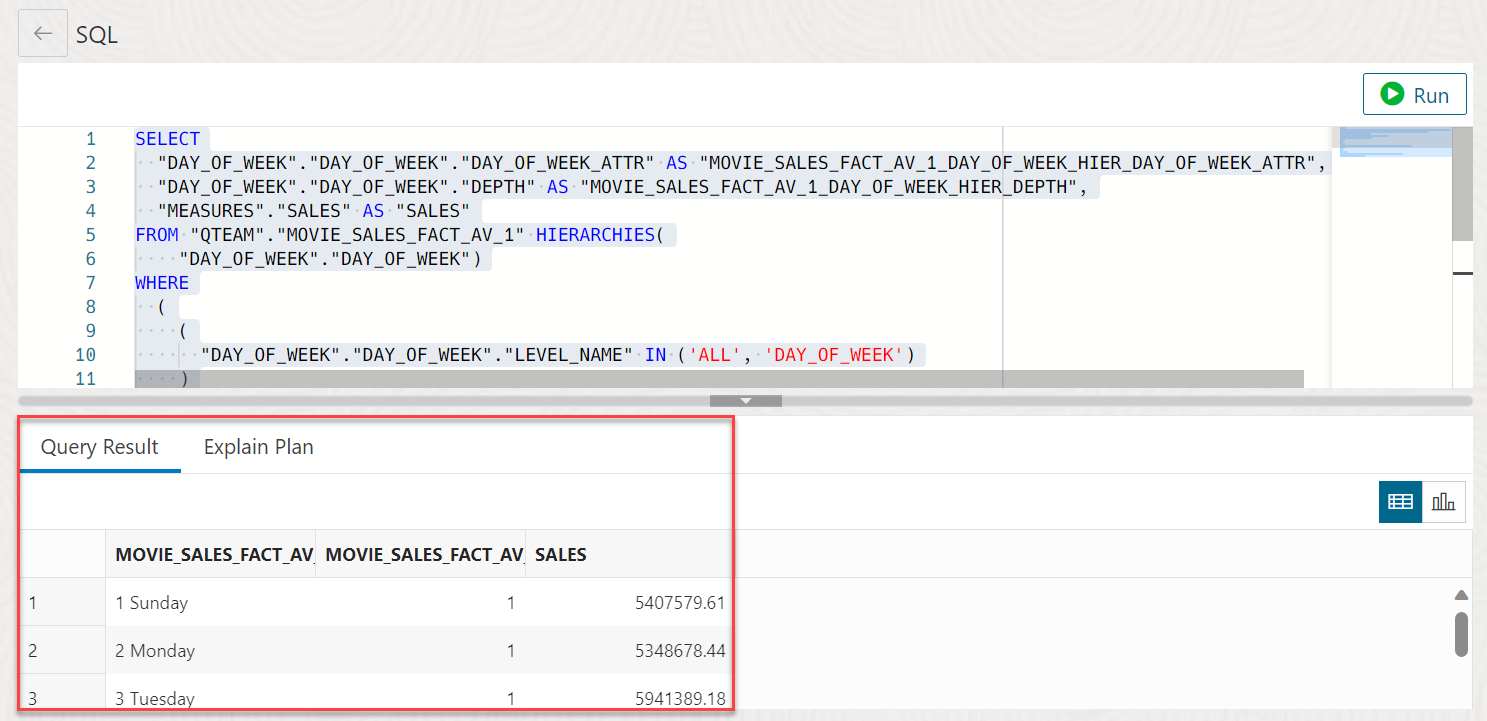
Description of the illustration sql-output.png
-
Query Result: Displays the results of the most recent Run Statement operation in a display table.
- Explain Plan: Displays the plan for your query using the Explain Plan command. The default view is the diagram view. For more information, see the description of Explain Plan Diagram in subsequent sections.
The Performance menu displays the PL/SQL procedures in the worksheet area which describes the reports associated with the Analytic Views.
The top part of the performance output consists of the worksheet editor for running SQL statements and an output pane to view the results in different forms. You can view the results in a Diagram View, Chart View, Clear Output from the SQL editor, Show info about the SQL statements and Open the performance menu in a new tab.
The following figure shows the output pane of the performance menu: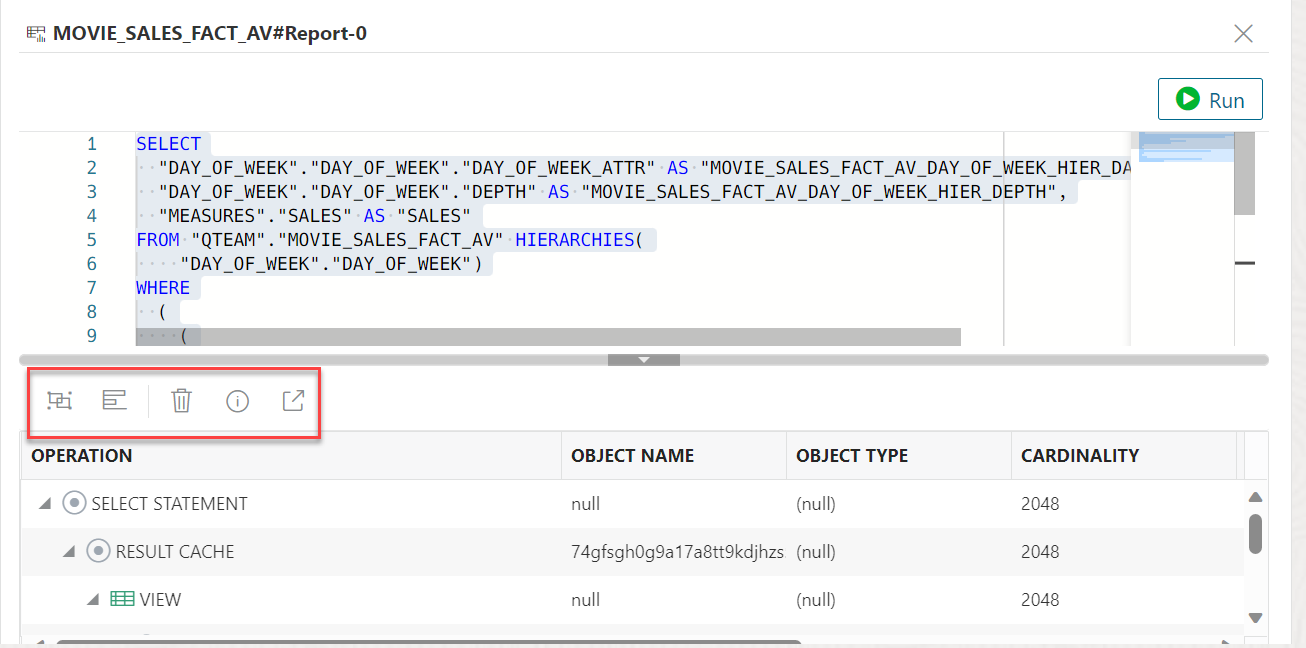
Description of the illustration performance-output.png
- Diagram View: Displays the plan of your query in the diagram view.
- Chart View: Displays the plan of the query in a chart view.
- Clear Output: Clears the PL/SLQ statements from the worksheet.
- Show info: Displays the SQL statement for which the output is displayed.
- Open in new tab: Opens the explain plan in a new window. An Explain Plan displays the plan for your query.
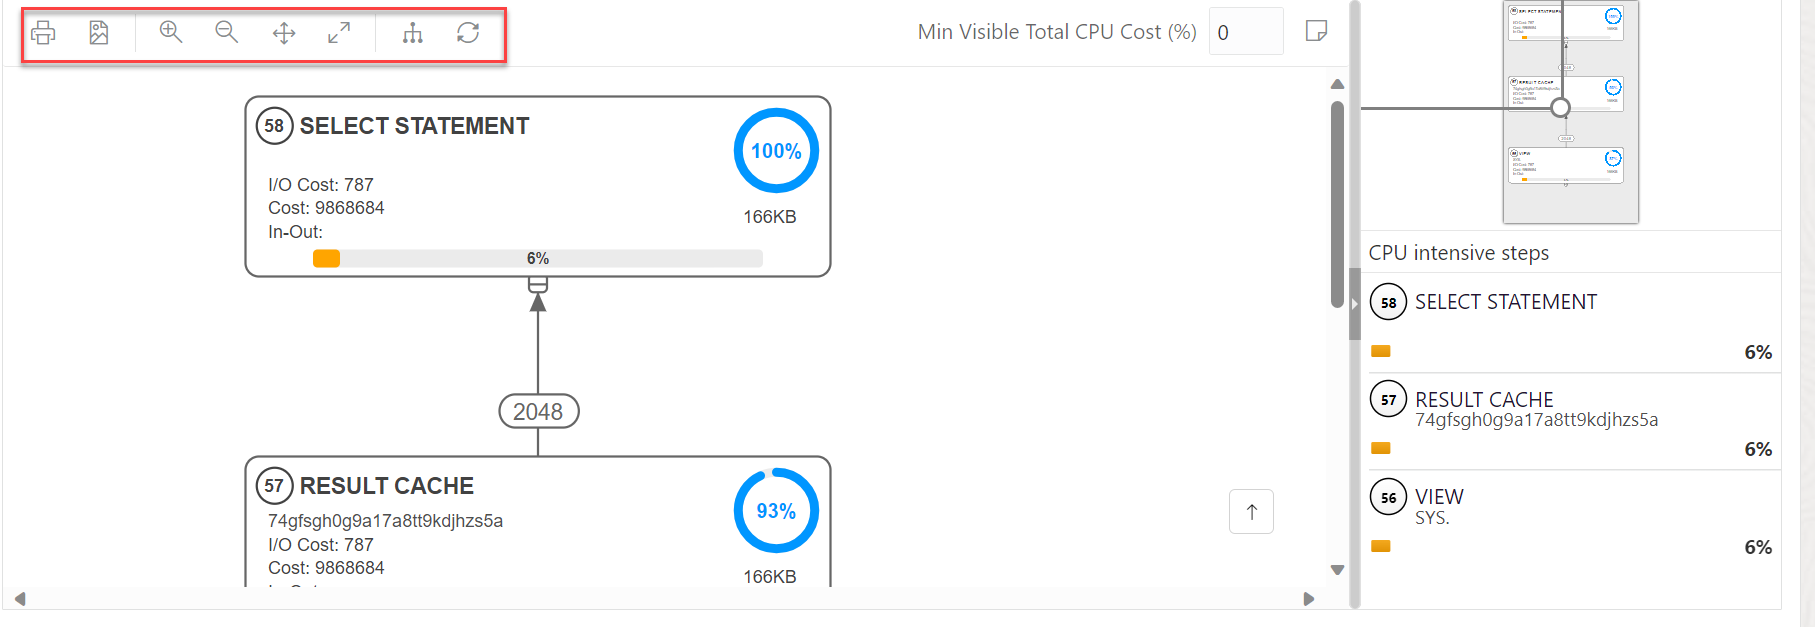
The Explain Plain diagram view is a graphical representation of the contents of the insert row statements in the SQL Query. The plan depicts the hierarchical nature of the steps in the execution plan.
By default, three levels of steps are visible in the diagram. You can use the +/- signs at the
bottom of each step (available when the step has children) to expand or collapse. Use Expand All in the toolbar to view all steps in the diagram.- Cardinality (number on the arrow to the parent step), which is the number of rows processed
- Operation and options applied in that step
- Execution order, which is the sequential number in the order of execution
- Access predicates CPU cost in percentage (orange bar)
- Total CPU cost for the step in percentage (blue circle)
- Estimated I/O Cost, Bytes processed, and Cost metrics
You can see a brief description pop-up when you hover over any of these statistics in a step.
- Advanced View: This is the default view of the query when you click Performance. Displays data from SQL Query in mixed tabular/tree view. There is a Diagram View icon that you can use to switch back to the diagram view.
- Chart View: Displays data from the SQL query in the form of charts.
- Print Diagram: Prints the diagram.
- Save to SVG: Saves the diagram to file
- Zoom In, Zoom Out: If a step is selected in the diagram, clicking the Zoom In icon ensures that it remains at the center of the screen.
- Fit Screen: Fits the entire diagram in the visible area.
- Actual Size: Sets the zoom factor to 1.
- Expand All: Displays all steps in the diagram.
- Reset Diagram: Resets the diagram to the initial status, that is, only three levels of steps are displayed.
- Show Info: Shows the SELECT statement used by the Explain Plan functionality.
- Open in New Tab: Opens the diagram view in a new tab for better viewing and navigation. The diagram is limited to the initial SELECT statement.
- Min Visible Total CPU Cost(%): Defines the threshold to filter steps with total CPU cost less than the provided value. Enter a value between 0 and 100. There is no filtering for 0.
- Plan Notes: Displays the Explain Plan notes.
Properties in Explain Plan Diagram
- Displays information for that step extracted from PLAN_TABLE in a tabular format. Nulls are excluded. You can select JSON to view the properties in JSON format.
- Information from OTHER_XML column of PLAN_TABLE. The information is displayed in JSON format.
- Working with Reports
Reports help you in analyzing Analytic Views and Queries. - Creating Reports on a Query
This section describes the steps to create reports on an SQL query. - Creating Reports on an Analytic View
This section describes the steps to create reports on an Analytic View:
Parent topic: The Data Analysis Tool
Working with Reports
Reports help you in analyzing Analytic Views and Queries.
The reports are based on the levels and measures you select for the Analytic View and the columns you select for a query.
Click Analyze in the Analytic View and click the Table you want to analyze to view the Analyses page.
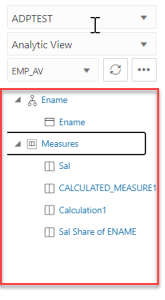
- Analytic View Browser: Select Analytic View from the drop-down if you choose to create reports on Analytic Views to view an Analytic View browser. The Analytic View browser displays the Hierarchies, Levels, and Measures associated with the selected Analytic View.
Table Browser: Select Query from the drop-down if you choose to create a report on SQL query to view a Table browser. If you select SQL Query, the Table browser displays the available tables and their corresponding columns. You can drill down tables to view their corresponding columns.
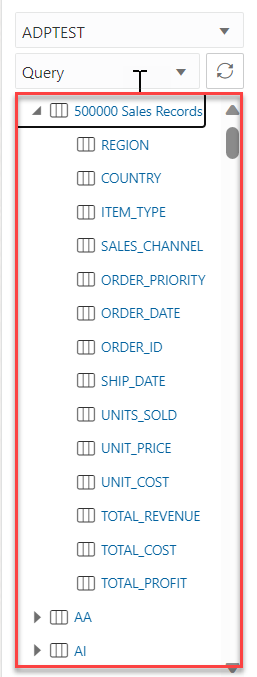
Description of the illustration table-browser.png - SQL Worksheet editor with the Run icon: You can view this component only when you generate a report on a SQL Query and not an Analytic View.
The SQL editor area enables you to run SQL statements and PL/SQL scripts from the tables you want to query displayed on the Table browser. By default, the SQL editor displays the Select * statement to display all the columns from the first table. Click Run to run the statements in the editor.
Description of the illustration run1.png - Output pane: The output pane, when you view the results of a SQL Query, consists of the following tabs:
- Query Result: Displays the results of the most recent Run Statement operation in a display table.
- Explain Plan: Displays the plan for your query using the Explain Plan command. For more information, refer to the Explain Plan Diagram in Creating Reports section.
- Autotrace: Displays the session statistics and execution plan from
v$sql_planwhen running an SQL statement using the Autotrace feature.
- Modes of visualization in the Query Result tab: You can select any of the four modes to visualize the results of the SQL query report you generate.The four modes of visualization, when you view the reports generated on a SQL query, are:
- Base Query: This type of view is by default. Query written in the SQL editor is the Base Query.
- Table: You can view the SQL results in tabular form. By selecting this view, a Column drop zone appears which enables you to drag and drop selected columns from the Table browser. By dropping the selected columns in the drop zone, you can view only those columns in the Query Result tab. Select the cross mark beside the Column name to remove it from the drop zone.
- Pivot: You can view the results of the SQL query in pivot format. By selecting this format, a Columns, Rows, and Values drop zone appears where you can drag and drop the selected columns, rows or values from the Tables browser.
Note
Values must be a NUMBER type. - Chart: You can view the SQL results in the form of a chart. By selecting this view an X-axis and Y-axis drop zone appears. Drag and drop selected columns from the Table browser to the drop zone. You must ensure that only the columns with NUMERIC data type can be dropped in the Y axis. Otherwise, the display result would fail with a
Must be a NUMBER typeerror. You can add multiple values to the Y-axis. To view the results in the chart view of only a particular y axis, select the Y axis value from the drop-down.
- Modes of visualization of reports generated on an Analytic View: You can select any of the three modes to visualize the results of the report you generate on an Analytic View.The three modes of visualization when you view the reports generated on an Analytic View are:
- Table: You can view the SQL results in tabular form. By selecting this view, a Rows and Filters drop zone appears which enables you to drag and drop selected Hierarchies and Measures from the Analytic View browser. This way you can view the report results that consist of the selected hierarchies and measures.
- Pivot: You can view the results of the Analytic View report in the pivot format. By selecting this format, a Columns, Rows,Values and Filters drop zone appears where you can drag and drop the selected hierarchies and measures from the Analytic View browser.Note: Values must be a NUMBER type.
- Chart: You can view the report you generate on an Analytic View in the form of a chart. By selecting this view an X-axis, Y-axis, and Filters drop zone appears. Drag and drop selected columns from the Table browser to the drop zone. You must ensure that only the columns with NUMERIC data type can be dropped in the Y axis. Otherwise, the display result would fail with a
Must be a NUMBER typeerror. You can add multiple values to the Y-axis. You can select Horizontal and Vertical from the drop-down to view Horizontal and Vertical Charts respectively. You also have the option to select Area Chart, Bar Chart, Line Chart, and Pie Chart from the drop-down.
- Faceted search panel: For the reports you generate on a SQL query and an Analytic View, you can view a Faceted search column. For a SQL report, this panel allows you to add filters to the report. The tool generates a filter for each value in the column that is retrieved from the query result. You can filter different columns on the faceted search panel and view the results in the Query result to get only the data you wish to view. You can view the data retrieved from the SQL query in either text or visual format. For reports you generate on an Analytic View, select Faceted from the radio button. This filter behaves differently than the Faceted search you generate on an SQL Query. See Adding filters to a report you generate on an Analytic View.
The Analyses page when you create a report on an SQL query looks like this: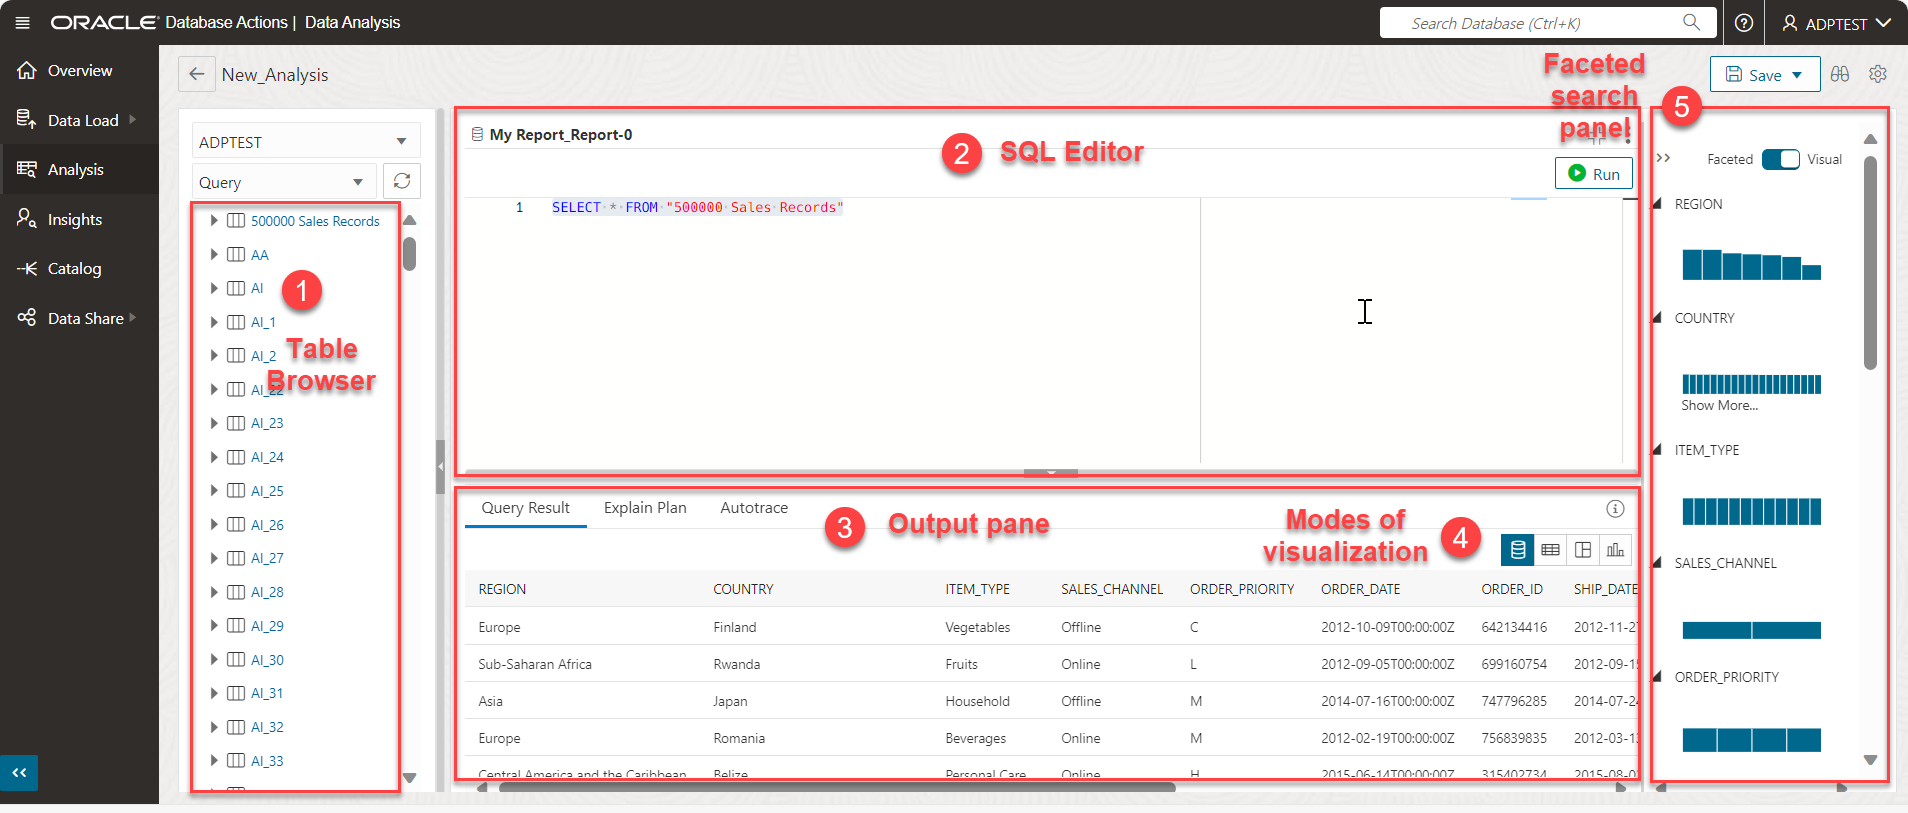
Description of the illustration analyses-report.png
The Analyses page when you create a report on an Analytic View looks like this: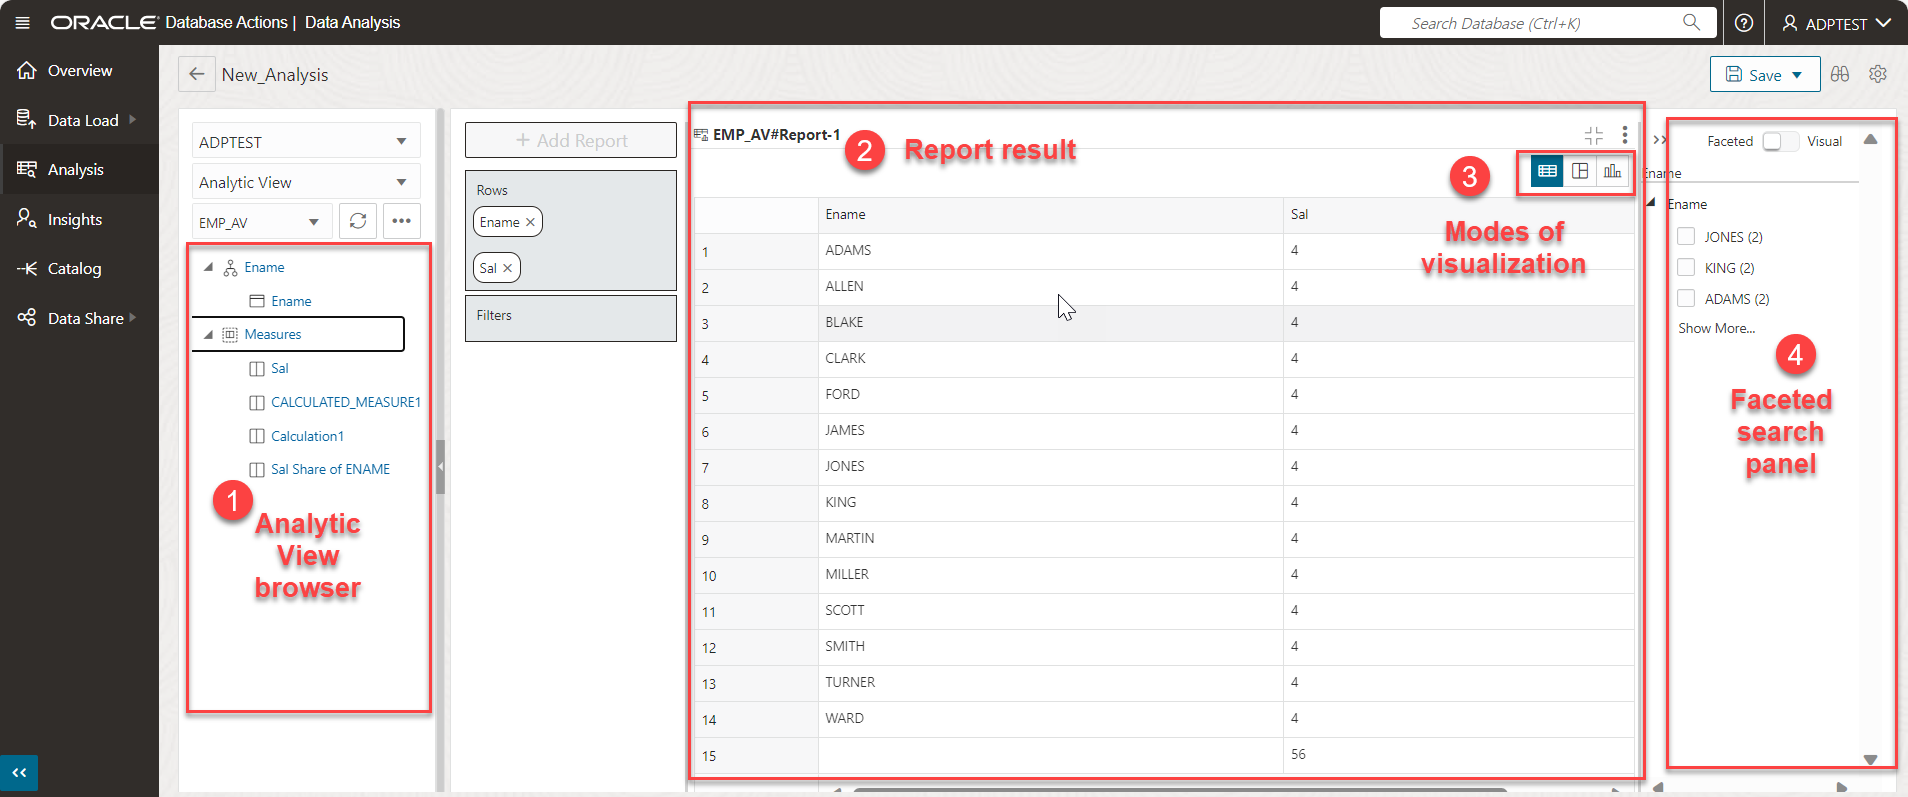
Description of the illustration analyses-av.png
The following topics describes how to create a report and access the Analyses page:
- You can create Reports using either of the following ways:
- Adding filters to a report you generate on an Analytic View
Parent topic: Creating Reports
Creating Reports on a Query
This section describes the steps to create reports on an SQL query.
- From the Analysis home page, select any of the Tables you want to create a report on. You will view the Analyses page with a default query displayed on the SQL editor.
Note
By default, you will view “Select * from the <Tablename> you select. -
Click Run to run the SQL statement.
The Query Results tab displays the result in whichever mode you select. The default view is Base Query.
-
Add a filter to the report by displaying the Sales Records of only Asia region. Select Asia from the faceted search panel.
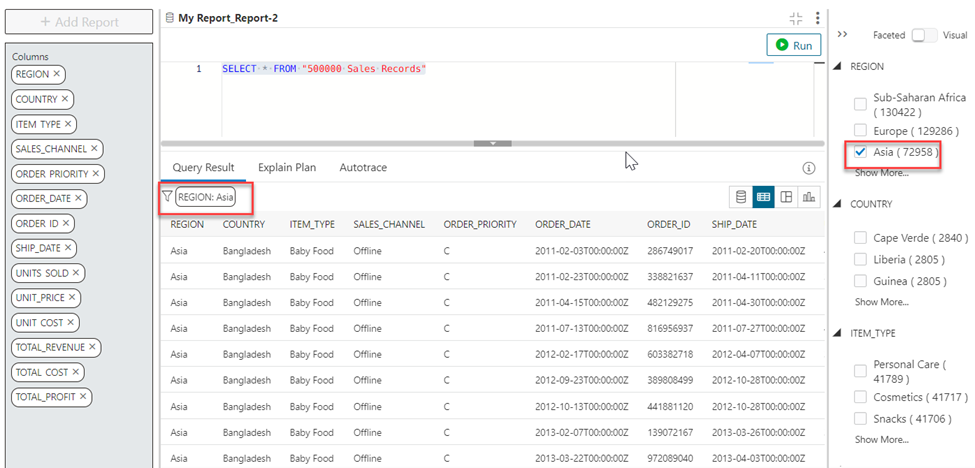
Description of the illustration filter.png - You will view a funnel icon in the Query Result tab which displays a filter with the REGION column as Asia. The Query Result will display only the records with REGION as Asia.
Parent topic: Creating Reports
Creating Reports on an Analytic View
This section describes the steps to create reports on an Analytic View:
- From the Analysis home page, under the Analytic View section, select any of the Analytic Views you want to create a report on. You will view the Analyses page with a default report displayed as the output.
- Drag and drop hierarchies and measures from the Analytic View browser to edit the results you view in the output. For more information, refer to Working with Reports.
- Click Expand Report to expand the view of the report and click Collapse Report to minimize the view of the report. The default view of the report you generate on an Analytic View is Pivot.
Adding filters to a report you generate on an Analytic View
- From the Analyses page which displays the report you generated on an Employee Analytic View, select “Scott from the faceted search panel. You will view the report displaying the result of employees named Scott.
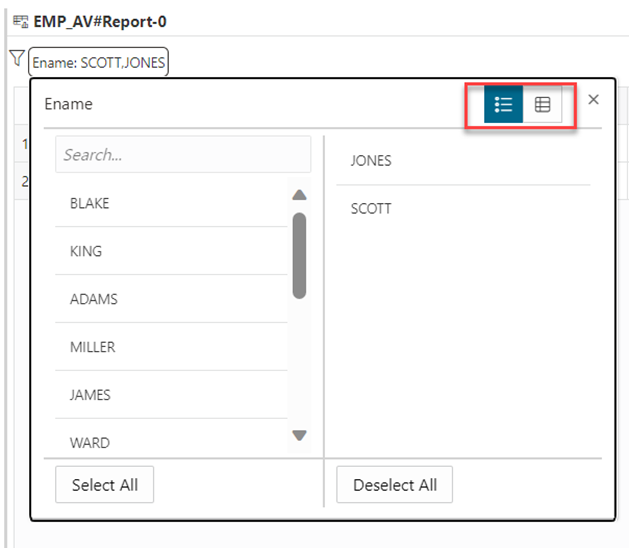
- You can select more filters by selecting the values from the faceted search panel, or by clicking the funnel.
- Clicking the funnel icon displays all the values of the Employee name column. Select Jones to filter the report results further displaying the salary of employees named Scott and Jones. You can view the values in a list view or a multi select view.
- Select Deselect All to remove all filters.
You can now view the original report result that does not consist of any filters.
Parent topic: Creating Reports
