Create Alarms
Setting Alarms
When a metric condition is met, you can use the Monitoring service's alarm system to alert interested parties to conditions. You can create alarms on individual resources or on an entire compartment.
Ops Insights provides convenient access to Monitoring service's alarm creation functionality directly from any fleet resource page.
- From the left pane, click Administration.
- Click on a fleet resource. (Database Fleet, Host Fleet, Exadata Fleet, Ops Insights Warehouse).
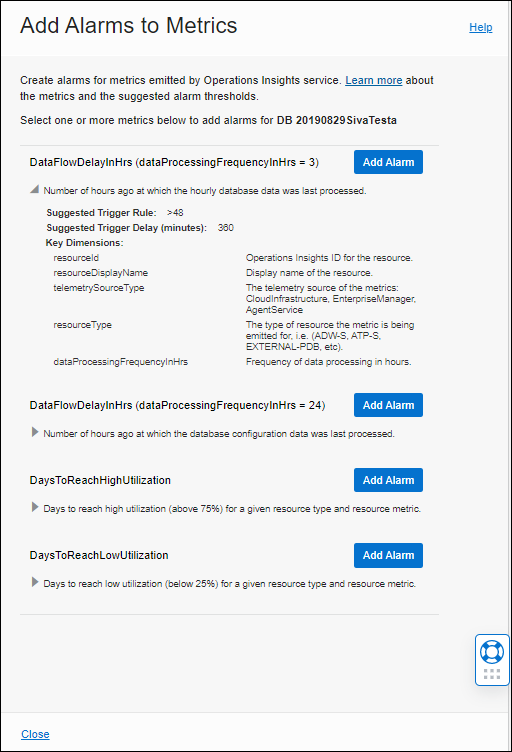
- Click on the Action menu (vertical ellipses) for a specific resource and select Add Alarms. The Add Alarms to Metrics region displays. Expand the description region below each metric to view suggested trigger parameters as well as key dimensions.

- Click Add Alarm. You'll be taken to the Monitoring service Create Alarm page with the required metric details already populated.
Note
By default, an alarm applies to an individual resource. If you want the alarm to apply to an entire compartment, remove theresourceID. - Under Notification>Destinations, Select a topic or channel that you want to use for sending notifications when an alarm is triggered. Alternatively, you can create a topic.
- Provide an alarm name and set the suggested threshold and trigger delay.
- Click Save alarm.
Specific Alarm Conditions
SQL Alarms
You can create alerts to conditions defined for the NumSqlsNeedingAttention metric. Alarms need to be created in a specific way in order for them to clear properly. The following examples illustrate how to trigger an alarm under various alert conditions.
| Alarm Condition | MQL Alarm Definition |
|---|---|
| You want to trigger an alarm if the total number of SQL statements across all resources, which are both degraded and have a plan change, is greater than 5. | |
| You want to trigger an alarm whenever any resource has a plan change. | |
| You want to trigger an alarm whenever resource has a plan change. | |
Similar patterns can be used for any of the dimensions. In general, to trigger an alarm on a specific condition, the generic alarm definition syntax would look like the following:
NumSqlsNeedingAttention[3h]
{dim1="val1", dim2="val2", ....}
.absent()==0 && NumSqlsNeedingAttention[3h]
{dim1="val1", dim2="val2, ...}
.sum() > 5You must specify both and absent condition and a threshold condition as shown above and the dimension specification must be the same in both clauses. You should only change the dimensions or the threshold value as needed and leave the other values as is.
Data Flow Delays
You can create alerts to conditions defined for the DataFlowDelayInHrs metric. The following table shows some recommended alarms you can set up along with a corresponding Monitoring Query Language (MQL) example which you can use as a template to define your alarms. For more information about setting up alarms, see Managing Alarms.
| Alarm Name | MQL Alarm Definition | Description |
|---|---|---|
DataFlowSourceAlarmFor1HrData |
DataFlowDelayInHrs[1h]{dataProcessingFrequencyInHrs="1.00"}.grouping(telemetrySourceType , sourceIdentifier).mean() > 48Pending duration: 1h |
For a sourceType, sourceIdentifier with 1 hour data processing frequency, the mean value (across targets) of DataFlowDelayInHrs is greater than 48 hours for continuous 6 hours. This indicates that the problem is at the whole source level. |
DataFlowResourceAlarmFor1HrData |
DataFlowDelayInHrs[1h]{dataProcessingFrequencyInHrs="1.00"}.grouping(telemetrySourceType, resourceId,resourceDisplayName, sourceIdentifier).max() > 24Pending duration: 1h |
For a sourceType, resource & sourceIdentifier, DataFlowDelayInHrs is more than 24 hours for continuous 1 day for the type of data for which data processing frequency is every 1 hour. |
DataFlowResourceAlarmFor3HrData |
DataFlowDelayInHrs[3h]{dataProcessingFrequencyInHrs="3.00"}.grouping(telemetrySourceType, resourceId, sourceIdentifier).max() > 48Pending duration: 1h |
For a sourceType, resource & sourceIdentifier, DataFlowDelayInHrs is more than 48 hours for continuous 1 day for the type of data for which data processing frequency is every 3 hours. |
DataFlowResourceAlarmForDailyData |
DataFlowDelayInHrs[3h]{dataProcessingFrequencyInHrs="24.00"}.grouping(telemetrySourceType, resourceId, sourceIdentifier).mean()Pending duration: 1h |
For a sourceType, resource & sourceIdentifier, DataFlowDelayInHrs is more than 72 hours for continuous 1 day for the type of data for which data processing frequency is every 24 hours. |
About Forecast Issues
Ops Insights provides metrics to help you configure alarms for high (default value >75%) or low (default value < 25%) utilization for a given resource and resource metric. Additionally you can customize these forecast metric thresholds. Helping provide more granular capacity management forecasting, allowing you to be more proactive in resource management by setting threshold values that are more relevant to a specific target type for more accurate forecasting. For more information on setting threshold values see: Changing Utilization Thresholds.
The forecast metrics are generated using at most 100 days of history data and forecast window of 90 days. You can verify the forecast from Ops Insights console by selecting 1 year in the Time Range Filter and High or Low utilization for 90 days, as shown below.


The following table shows a sample of a recommended alarm you can set up along with a corresponding Monitoring Query Language (MQL) example which you can use as a template to define your alarms. For more information about setting up alarms, see Managing Alarms.
| Alarm Name | MQL | Description |
|---|---|---|
DaysToReachHighUtilizationStorageLessThan30D |
DaysToReachHighUtilization[1D]{resourceMetric="STORAGE", resourceType="Database", exceededForecastWindow="false"}.grouping(telemetrySource,resourceId).mean() < 30," |
For sourceType, resourceType, resourceMetric and sourceIdentifier, DaysToReachHighUtilization is less than 30 days. |
DaysToReachHighUtilizationExaStorage |
DaysToReachHighUtilization[1D]{resourceMetric="STORAGE", resourceType="Database", exceededForecastWindow="false"}.grouping(telemetrySource,resourceId).mean() < 30, |
For sourceType, resourceType, resourceMetric and sourceIdentifier, DaysToReachHighUtilization is less than 30 days. |
For linear and seasonality aware forecasts, the forecast window is 90 days, which means that if a specific resource has a forecast of more than 90 days, by default the metric value will show 91 days. For AutoML this is forecast by number of data points available.