Database Capacity Planning
Use the Capacity Planning Database menu item to access a summary of database CPU, Storage, Memory, and I/O utilization across the selected compartment.
From the Database Capacity Planning Summary page, you can view current database resource utilization by CPU, storage, memory, and I/O. You can also compare and contrast resource usage between databases, and identify which databases use the most resources, and are expanding rapidly.
This page directly supports the goals of providing a birds-eye view of database resource usage and trends, and providing proactive insights into specific utilization issues either current or forecast for the near-term.
Capacity Planning color scheme associates green with CPU resources and blue with Storage resources.
- View total allocation and utilization of CPU, Storage, Memory, and I/O resources for all (enabled) databases in the compartment
- Identify top-5 databases of CPU, Storage, and Memory by absolute usage or utilization percentage
- Identify top-5 databases by CPU, Storage, and Memory growth over the time period
- See aggregated historical usage trends for CPU, Storage, and Memory over the time period
A Collection Issues widget will appear under Databases if there are any database resources experiencing collection issues. Click on the widget to navigate to the database Collection Issues dashboard.
Memory usage information is not available for Autonomous AI Databases serverless.
The section shows the current utilization of databases and the databases that are reaching the server capacity headroom.
CPU Insights, Storage Insights, and Memory Insights.
These sections show the number of databases running with low (0–25%) and high (75–100%) utilization of resources. For CPU utilization, it is the utilization percentage for the 90th percentile value of the daily average CPU usage over the selected time period. That is, if the 90th percentile value of CPU usage is associated with utilization above the 75% threshold, then the database is considered high CPU utilization.
For Storage and Memory utilization, it is the databases forecast to reach high utilization (>75%) or maintain low utilization (<25%) within the 0-30 day time period. Forecast training data are based on the selected historical data time period.
You can drill down to view the CPU, Storage or Memory breakdown for either individual databases or for an aggregated view of all databases.
Filters
The Filters section allows you to refine the information presented to a specific subset of the data, you can filter by:- Database Type:
- Autonomous AI: LH-D, LH-S, ATP-D, ATP-S, LH-C@C, ATP-C@C
- MySQL: MySQL HeatWave
- Oracle Base DB: BM PDB, and VM NonCDB
- The Database by entity slide out allows you to select databases by:
- Name
- Host name
- Container Database name
- VM cluster name
- Exadata System name
- Time Range: Define the time range to view
Changing Utilization Thresholds
By default, Ops Insights sets the high and low utilization thresholds at 75% and 25%, respectively, for CPU, Storage, and Memory Insights. Customizing these forecast metric thresholds provides more granular capacity management forecasting, thus allowing you to be more proactive in resource management by setting threshold values that are more relevant to a specific target type for more accurate forecasting.
To change a utilization threshold:
- Navigate to the Capacity Planning page.
- For any of the Insights, click the information icon (i) next to the right of Utilization. These information icons are metric specific (i.e. if you launch from CPU Insights this modifies CPU-specific configurations), click on the icon specific to what threshold type you wish to modify. A descriptive pop-up dialog displays.

- Click Edit Configuration. The Edit Configuration dialog displays.
- Enter new alert threshold percentages under User interface settings for:
- High Threshold
- Low Threshold
- Forecast algorithm: Seasonally aware, Linear, or AutoML
- Metric value: Average, or Maximum
Note
If you wish to reset any value to its default, click on Reset to default - Click Apply. Custom utilization thresholds apply to the current compartment.
Once applied, all Ops Insights statistics and forecast queries relying on these utilization thresholds will be updated to reflect the new threshold settings. For example, navigate to the CPU Insights. On the Aggregate tab, select Utilization Level from the Grouping drop-down menu. The aggregation chart, as well as Trend & Forecast chart, will reflect the new custom thresholds.
View Capacity Planning in Database Management
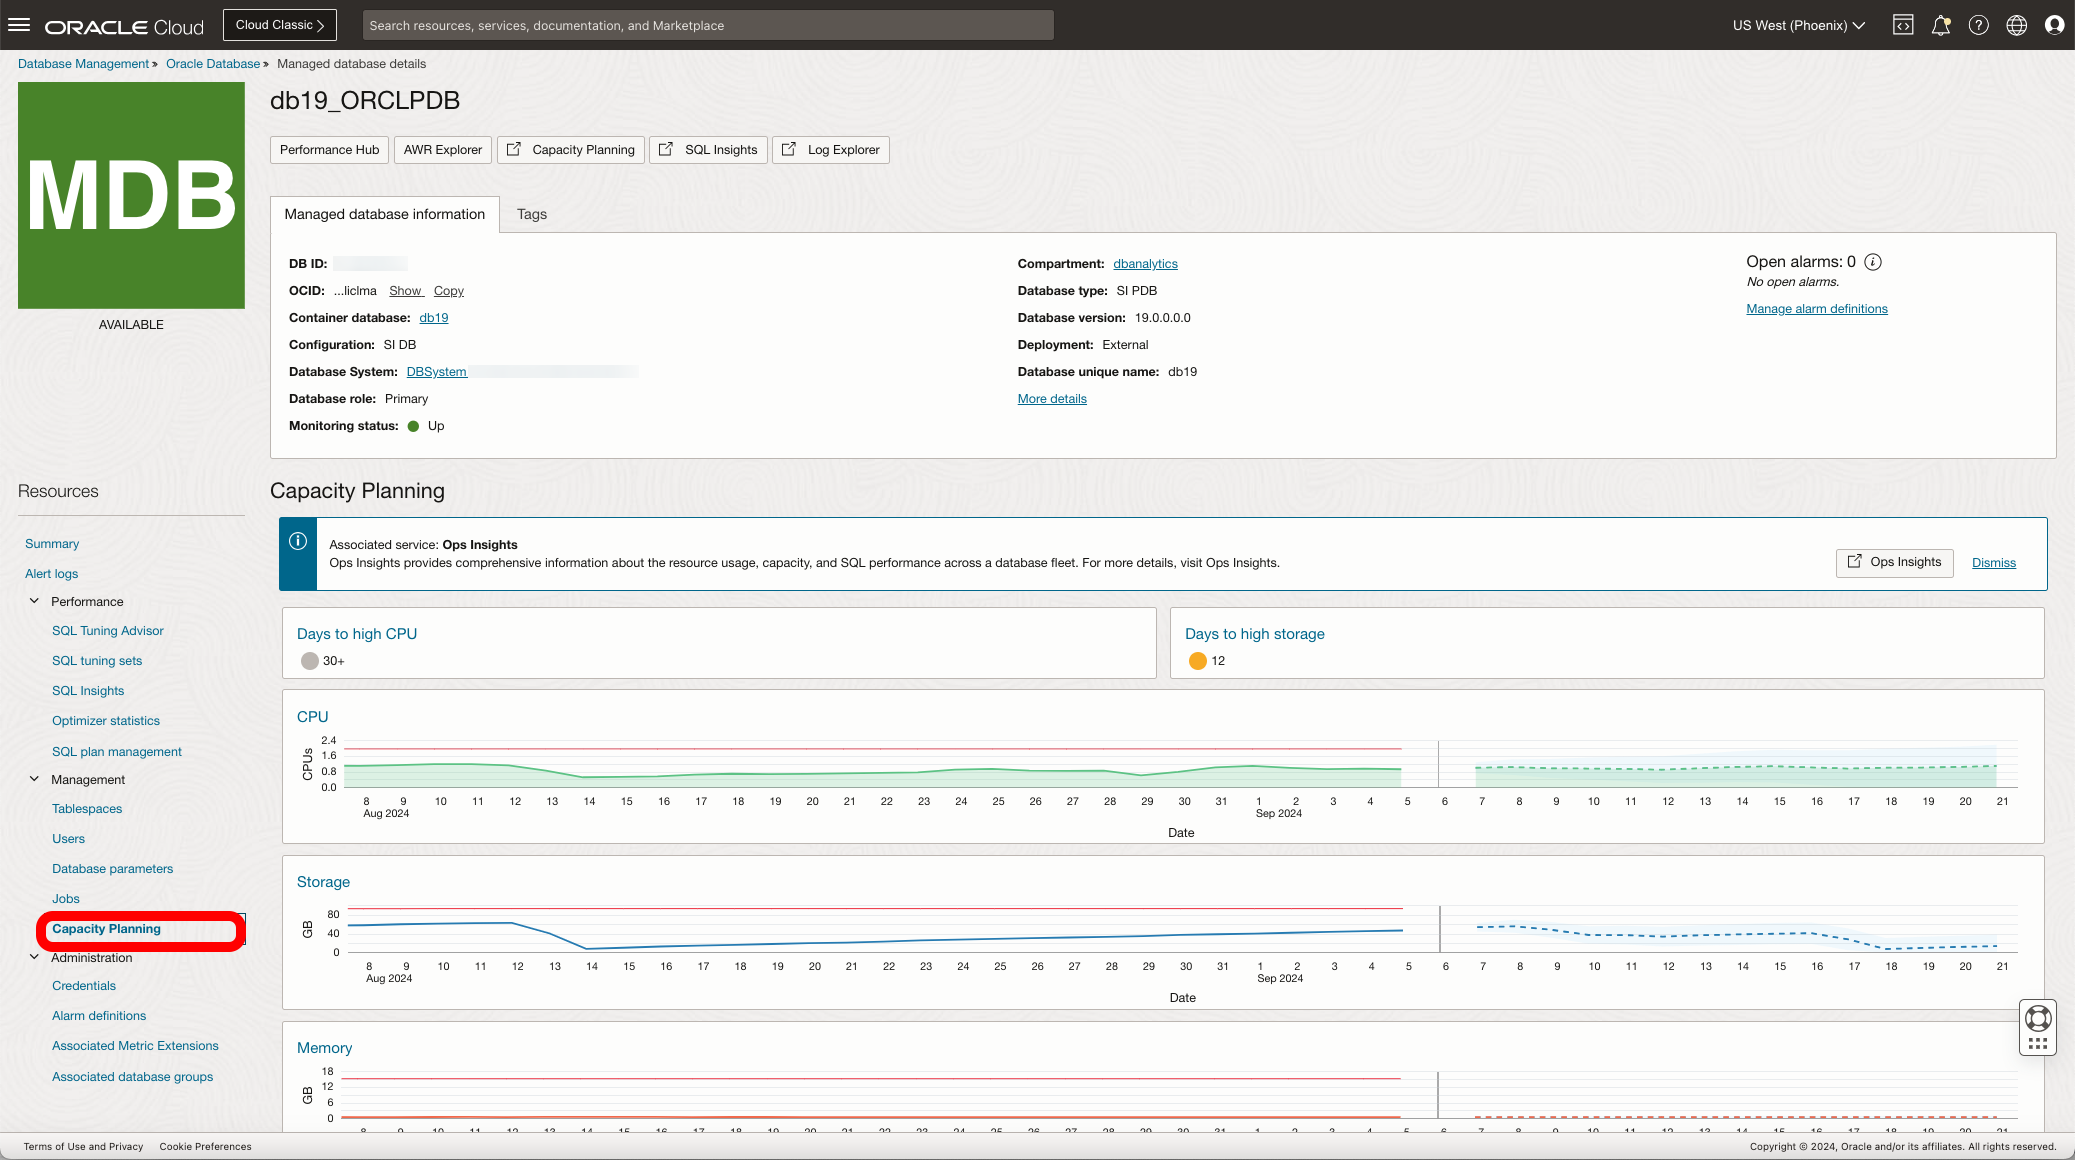
With Ops Insights enabled you can also view a Capacity Planning dashboard through Database Management. The dashboard shows last 30 days of data (with 15 a day forecast). Drill downs are available via the title (i.e. CPU) linking to Capacity Planning, allowing you to do a more customized forecasting.If Ops Insights is not enabled a button allows you to easily enable the service for the database being viewed.
To view the Capacity Planning dashboard, from the OCI menu navigate to Database Management, select the database and in the Managed database details, under Resources, expand the Management section and click on Capacity Planning. This will display the Capacity Planning Dashboard as seen below: