Collection Issues
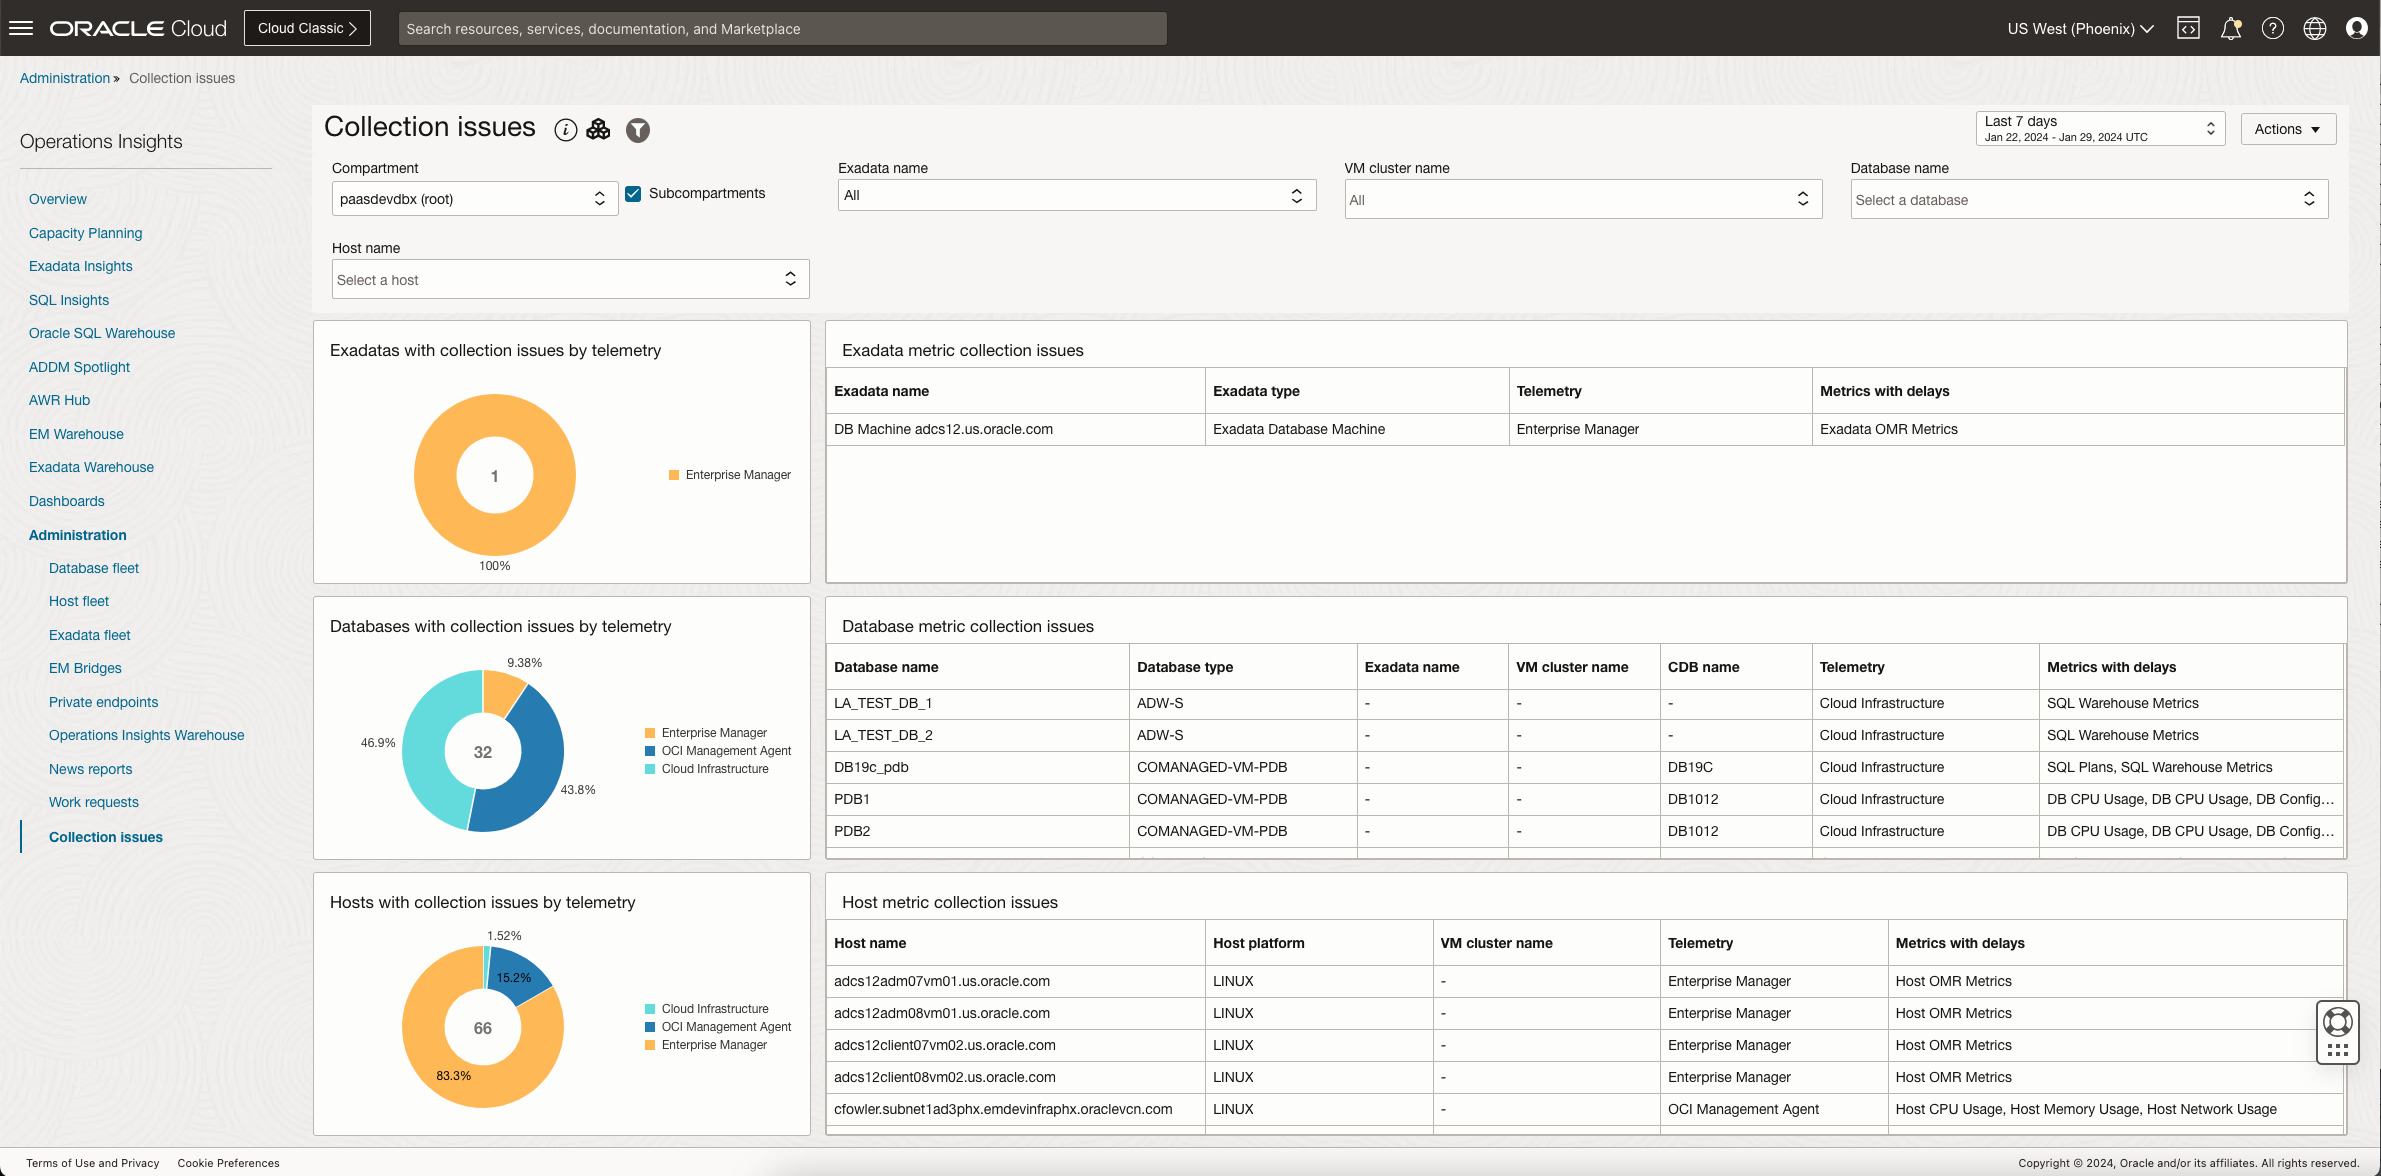
With the Collection issues dashboard, you can identify which Ops Insights registered Exadata, host and database targets are not actively collecting data.
Collection issues dashboard
To access the Collection issues dashboard and begin to review what targets are not collecting data, from the Administration menu, click on Collection Issues. Alternatively Collection issues dashboard can be found by navigating to Ops Insights, and click on Collection Issues.

The Collections issues dashboard is split into three main parts one for each target type: Exadata, database, and host. The dashboard features three pie charts showing the number of resources by their telemetry type, the percentage shown is in the pie chart represents the percentage of that telemetry type having issues. For example: if you have 100 total targets (50 Enterprise Manager targets, 50 OCI Management Agents) and 2 Enterprise Manager targets have collection issues and 1 OCI Management Agent, the number of targets with issues is 3. The percentages would be 66% for Enterprise Manager and 33% OCI Management Agents.
Each of the three sections also shows a table with specific details about the targets experiencing collection issues, allowing you to see additional fields for each target type. You can review which specific metrics are experiencing issues with the Metrics with Delays field within each of the three tables.
You can filter targets using the various drop down menu options located in the top part of the dashboard. Allowing you to filter by compartment, Exadata filter, VM cluster filter, database filter and host filter.
Collection Issues Widgets
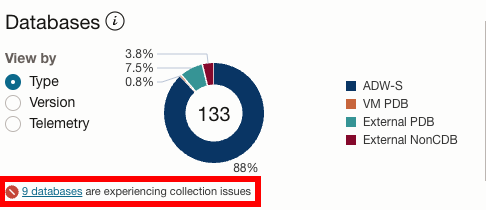
Ops Insights features special collection issues widgets located in Database Capacity Planning, Host Capacity Planning, and Exadata Insights. This widget will appear and alert if there are any targets experiencing collection issues. Click on the widget to navigate to the Collection issues dashboard.
