Using ADDM Spotlight
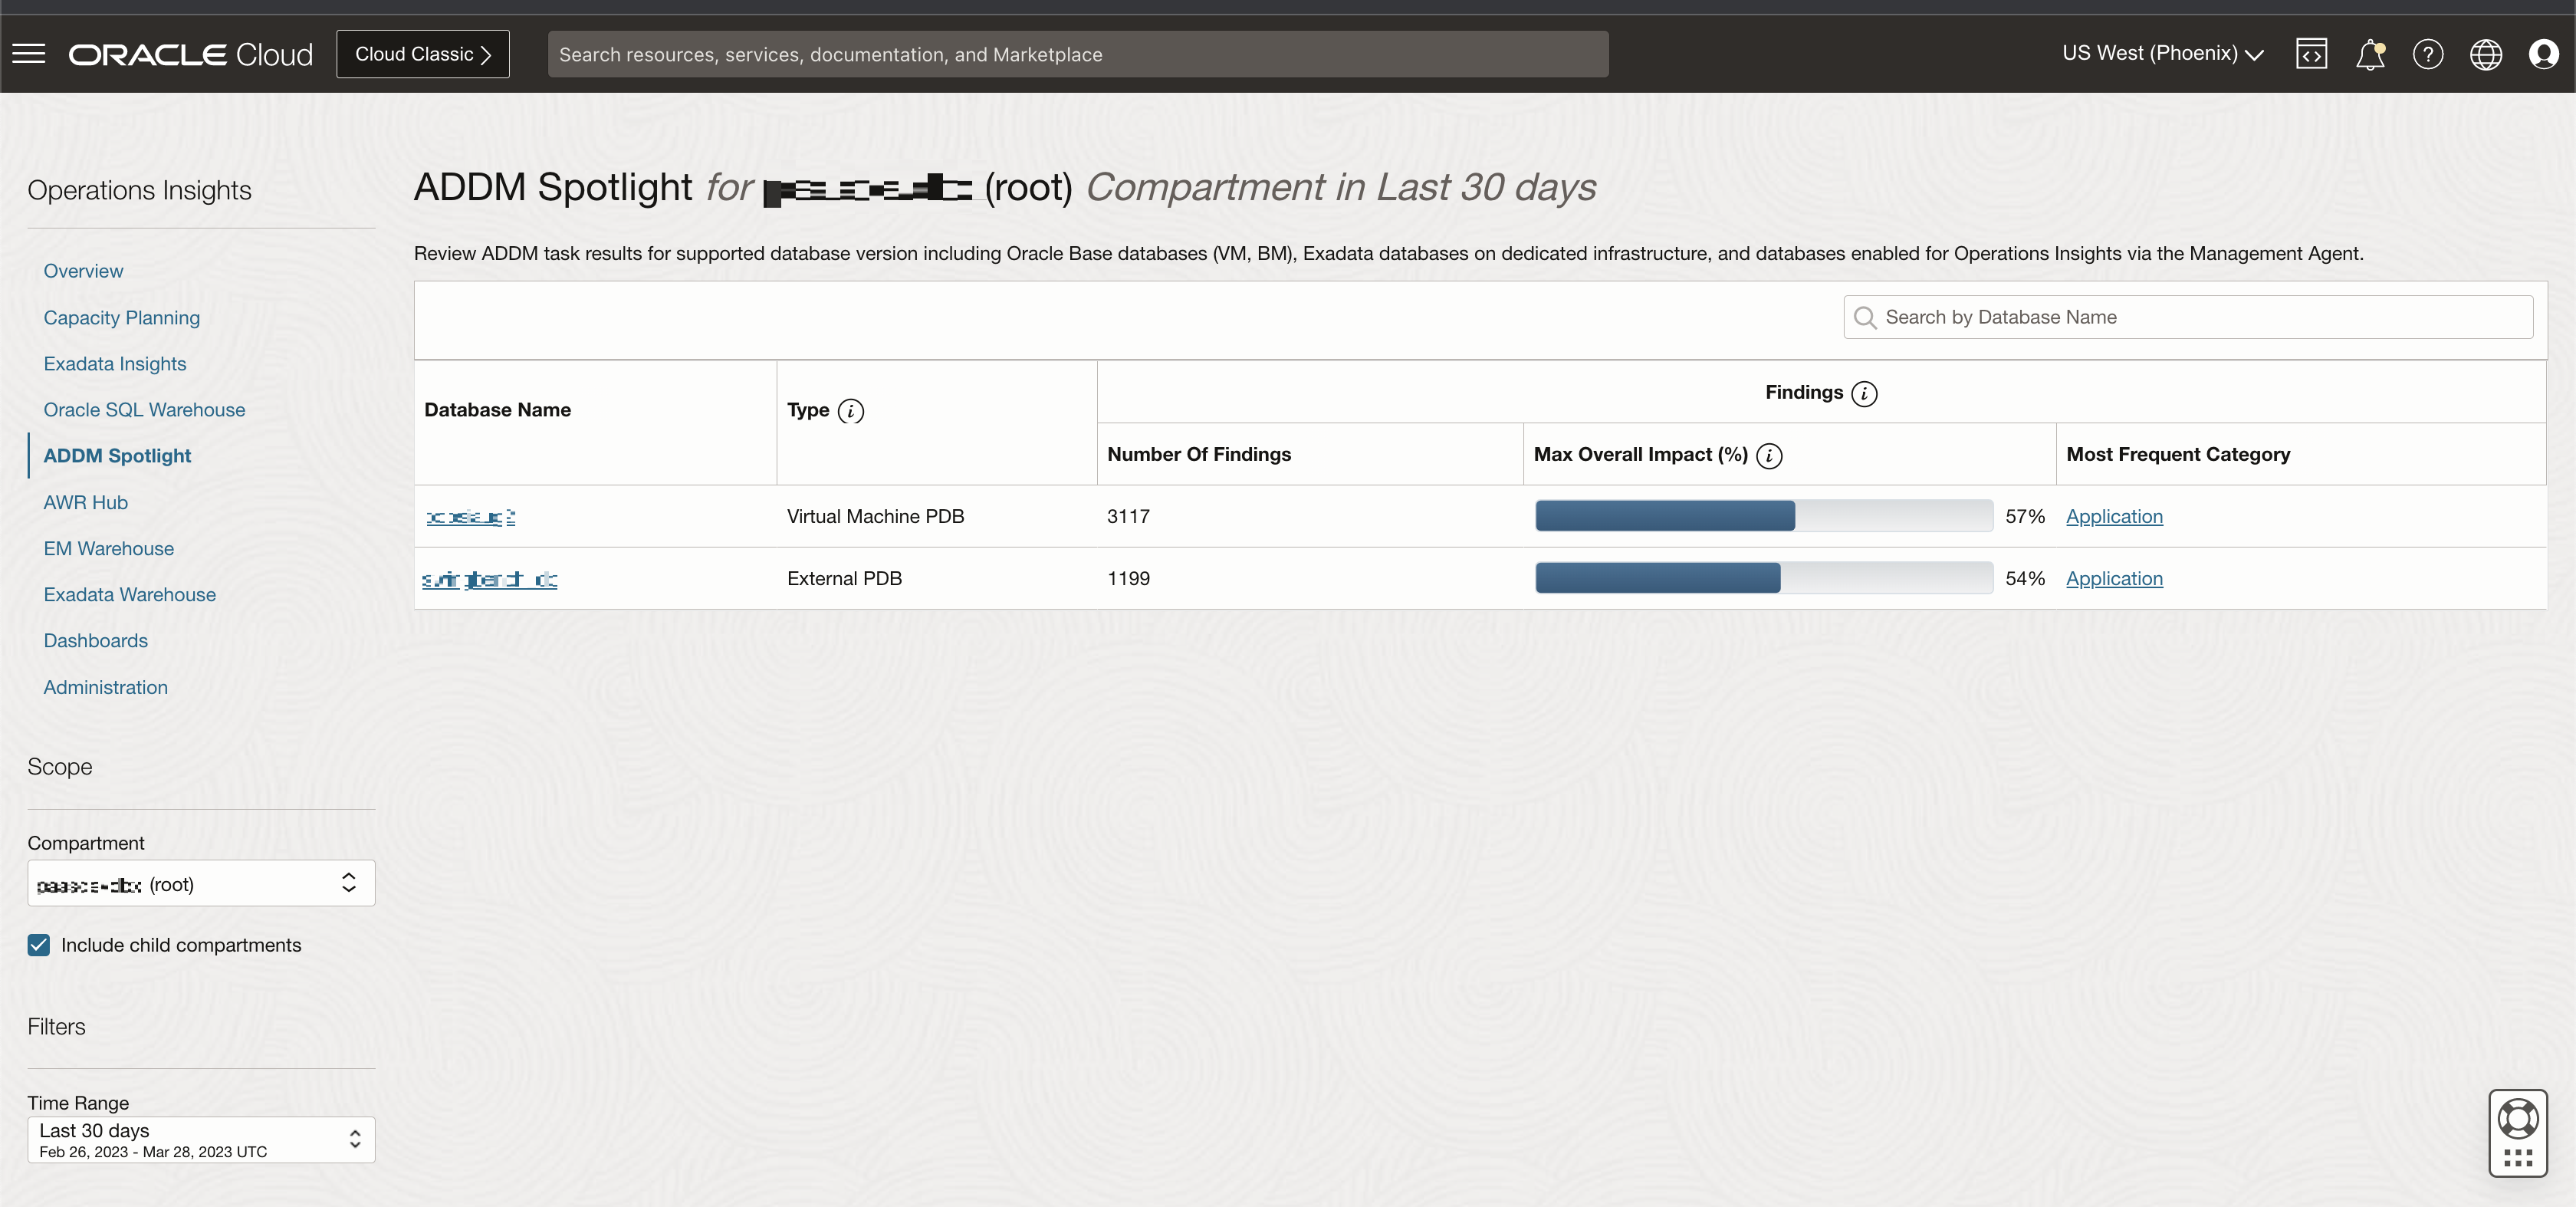
To access and view ADDM Spotlight, click on the Oracle Cloud menu select Observability and Management, then under Ops Insights click on ADDM Spotlight.
ADDM Spotlight Screen

Only Ops Insights enabled databases with ADDM Spotlight findings will be listed. If the databases are not enabled or have no findings they will not be listed.
- Database Name
- Type
- Number of Findings
- Max Overall Impact (%)
- Most Frequent Category
- Scope allows you to select the Compartment you wish to view, selecting a compartment will display all databases associated with that compartment. You can also view all child compartments by check marking Include child compartments.
- Filters allows you to further refine the Time Range. By default it will be set to Last 7 days, but can be set to Last day, Last 30 days, Last 90 days, Last 6 months, or a user defined Custom time range.
Review ADDM Findings for a Specific Database
To review a specific database's findings and recommendations first select the Compartment you want to view and click on the Database Name for the database you wish to review. This will load a new screen with information for only the chosen database, three informational tabs are displayed Findings, Recommendations, and Database Parameters. In a regular ADDM Spotlight findings review you will start at the Findings tab review the information presented, then move on to the Recommendations tab and finally into the Database Parameters tab. This allows you to observe the findings and see how much of an impact the issues found are having on your database, before moving onto recommendations to see how much of an improvement can be achieved by implementing the suggested recommendations. Lastly Database Parameters allow you to analyze what parameters have changed historically from your database configuration that could be impacting performance.- Findings: Data in this tab is presented in two formats under Summary. A graphical time series representation and a tabular data representation of the data. Using the Category bar you can search by Configuration, CPU, DB Internal, I/O, Network, or Other; these searches can be done with one or more categories. The timeline summary you visualize is common to the Findings and Recommendations tabs, this allows you to view and effectively compare what ADDM found and what ADDM recommends to correct these findings.

In the graphical time summary the number of findings are represented per day and color coded by Category type (Application, CPU, Other, etc). By adjusting the Time Range on the upper right corner you can view the data graph to a specific time range.
Within the data table you can view the exact findings that are being observed for this database. Information is presented by Category, Finding Name, Description, Frequency, Average Active Sessions, Max Impact, Overall Impact, and Recommendations (clicking on Recommendations takes you to its tab.Tip:
Frequency represents how many times the finding presented itself per task on the specified time frame.Impact represents the overall improvement impact that can be obtained by implementing the recommendation.
ADDM Spotlight in Ops Insights, allows you to add events to ADDM Spotlight charts to correlate configuration parameter change events with the timing of ADDM findings, to view Event Details check mark Include Event Annotations.
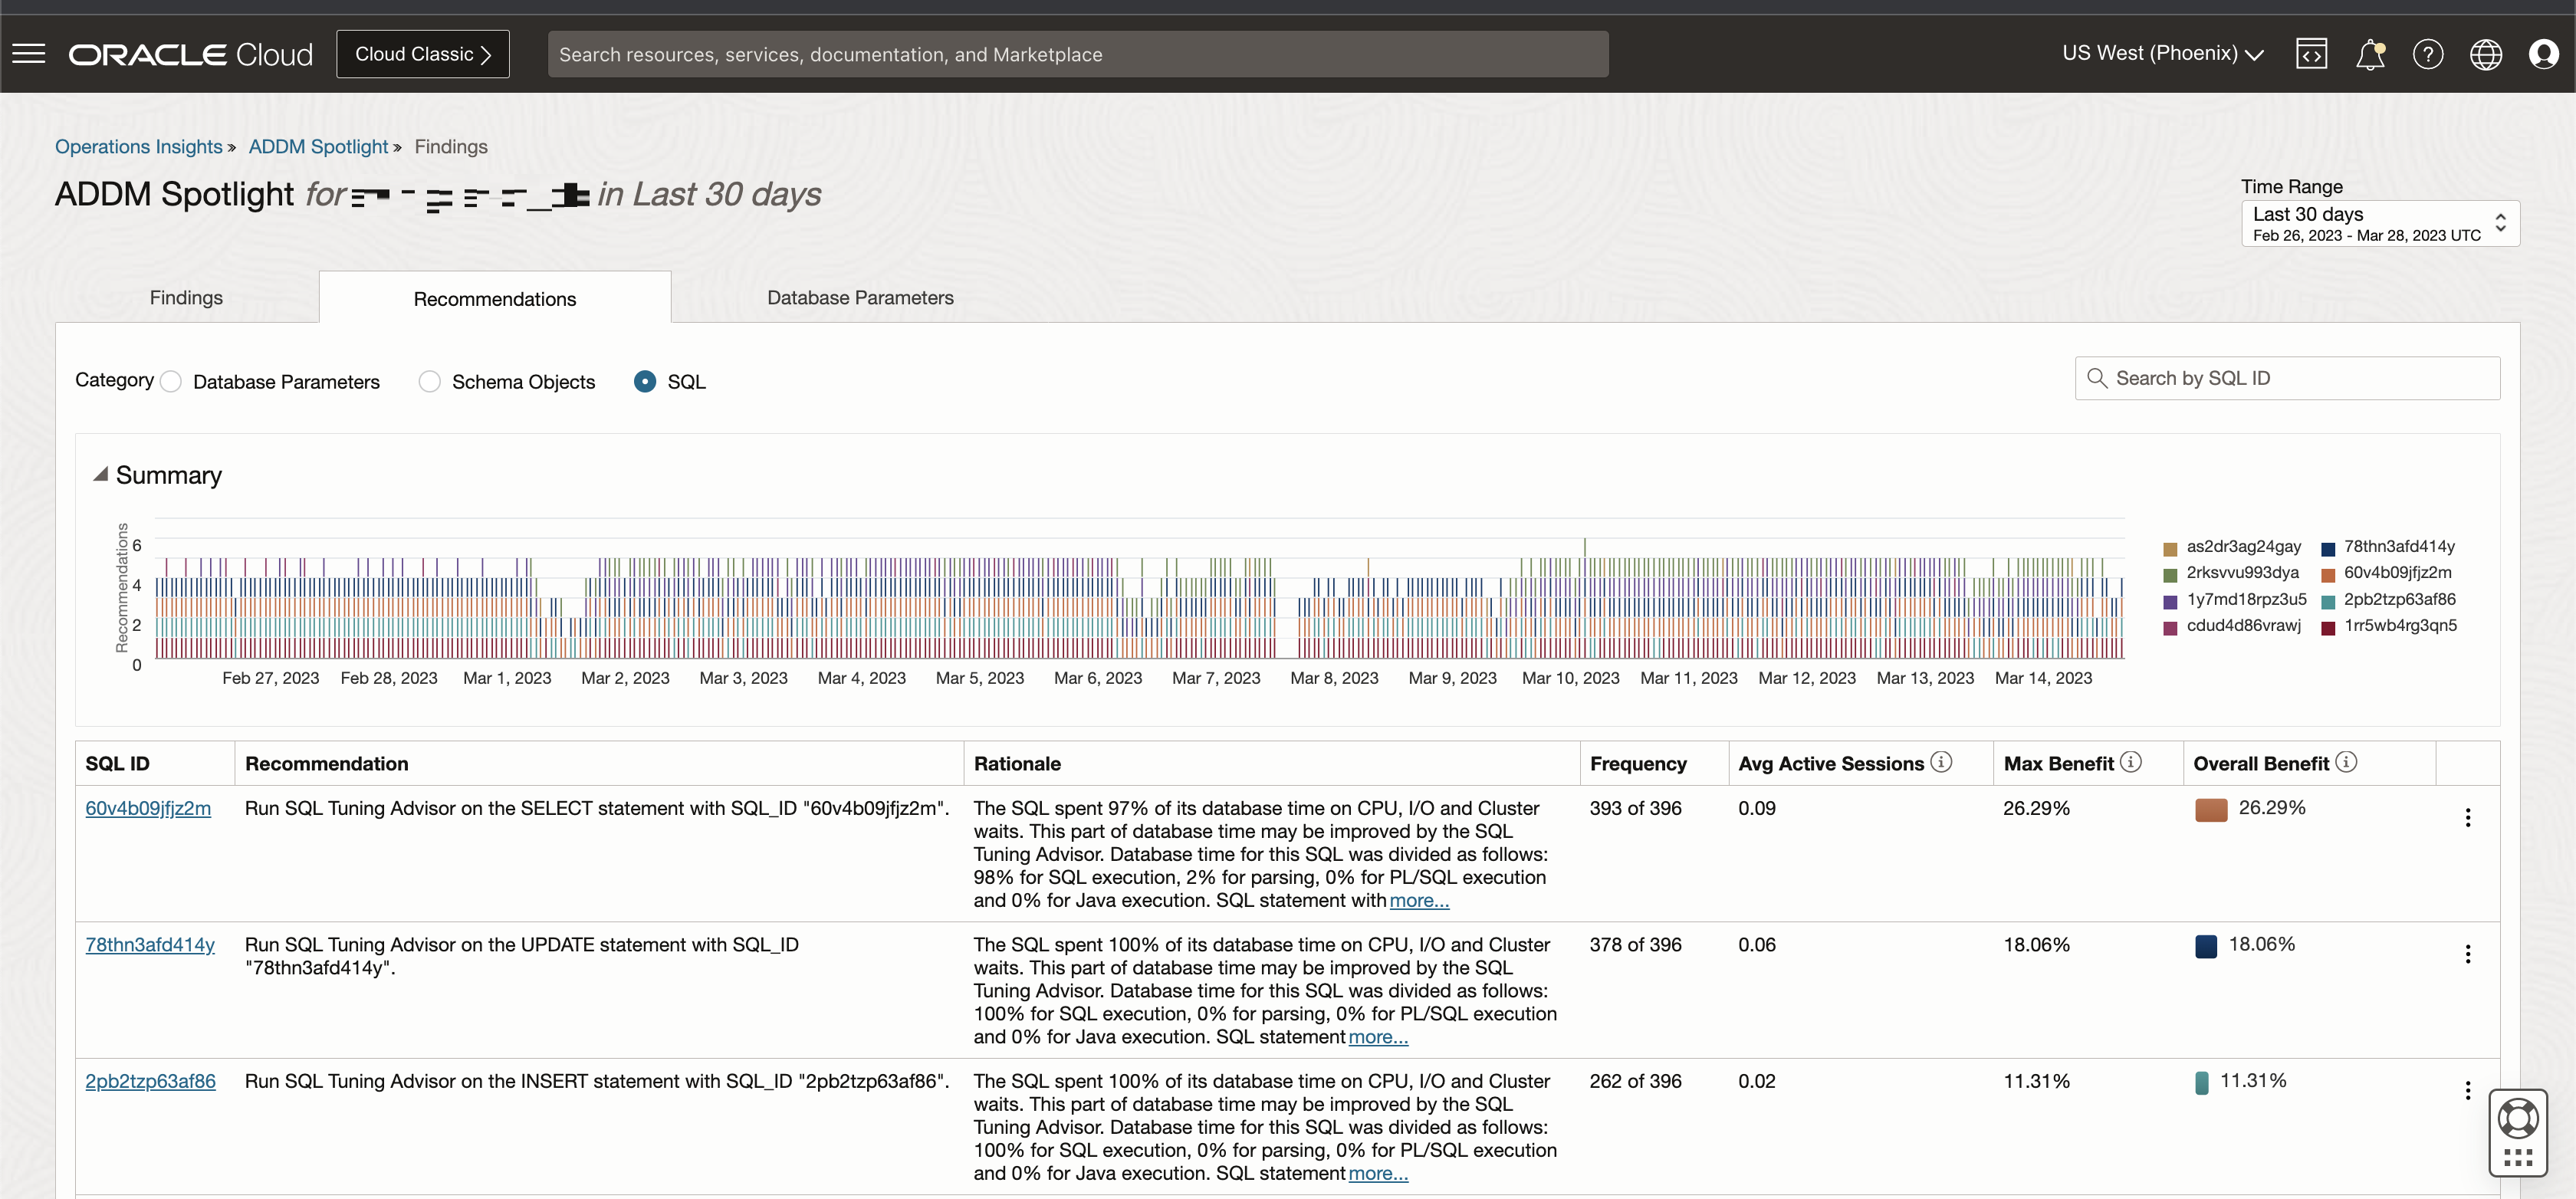
- Recommendations: In this table specific recommendations are suggested in order to remedy problematic findings. Filter pertinent information by selecting the Category you wish to see Database Configuration, Schema Object, or SQL Tuning. The timeline summary you visualize is common to the Findings and Recommendations tabs, this allows you to view and effectively compare what ADDM found and what ADDM recommends to correct these findings.

The Summary graph presents the number of recommendations per the selected Time Range, that can be adjusted to your preference.
Information on the table is presented by Type, Recommendation, Rationale, Frequency, Average Active Sessions, and Estimated Benefit.ADDM Spotlight in Ops Insights, allows you to add events to ADDM Spotlight charts to correlate configuration parameter change events with the timing of ADDM recommendations, to view Event Details check mark Include Event Annotations.
From the Recommendations tab you can access the SQL Tuning Advisor, select a database you wish to run SQL Tuning Advisor on, click the Action Menu to the right hand side, and click on Run SQL Tuning Advisor. This will open the SQL Tuning advisor page.Note
If the database selected does not have Database Management features enabled, you will be redirected to the Database Management UI wizard to enable the features. - Database Parameters: In this tab you can view parameters with High Impact, Non-Default Values, Changes, or Recommendations. Once the Parameter value is selected the table below is populated with the relevant parameters.
 From the Database Parameters tab you can edit the database parameters directly, select a database you wish to edit its parameters, click the Action Menu to the right hand side, and click on Edit Database Parameters. This opens the Database parameters page, in this page click on Edit Parameters to begin editing the database parameters.Note
If the database selected does not have Database Management features enabled, you will be redirected to the Database Management UI wizard to enable the features.
Troubleshoot ADDM Missing Data
If your ADDM Spotlight is missing data see the following MOS note: OCI Ops Insight: How To Troubleshoot ADDM Spotlight Issues 3039502.1.