Administer Data Flow
Learn how to administer Data Flow, including how to tune application runs, performance optimization, tuning object storage access, and best practices for Spark performance, and how to troubleshoot and correct common problems.
Tune Data Flow Runs
Tuning Overview
Before you tune a Spark application run in Data Flow, it's important to understand how it runs Spark applications. When you run a Spark application, a cluster of VMs is provisioned based on the VM shapes and counts you chose. Spark is run within this cluster. These VMs are private to your Spark application, but run within a shared, multi-tenant hardware and software environment.
When you start an application, you select one VM shape type for the Driver and another shape for the Workers. You also specify how many Workers you want. There's always only one Driver. The Driver and Workers are automatically sized to consume all CPU and memory resources in the VMs. If your workload needs larger or smaller Java Virtual Machines, you can control this by choosing a larger or smaller VM instance type.
Data Flow is designed to make using Oracle Object Storage simple and transparent. As a result, Object Storage is always one of the first things you should investigate when examining an under-performing application.
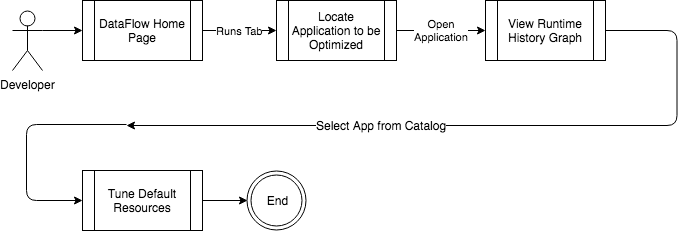
Performance Optimization
Throwing more resources at the problem is sometimes the best way to go, especially if the
application is already heavily optimized. Data Flow
simplifies this by tracking runtime history of all Spark applications, and centralizing
them in one place. Within the Data Flow UI, load the
application you want to optimize. In the Application detail screen, you see historical
Runs and the resources used during those Runs. Often, hitting your SLA is as simple as
using extra CPU and memory resources.
Tune Object Storage Access
Object Storage is deployed in all Oracle Cloud Infrastructure data centers. Access to Object Storage is highly performant, provided your Spark application is running in the same Oracle Cloud Infrastructure Region as where your data is stored. If data reads or writes are slow, confirm you're opening your Data Flow Application in the same region as your data. You can see the active region in the Oracle Cloud Infrastructure UI. REST API must also be targeted to a specific region.
Spark Performance Best Practices
- Use object storage. Object storage provides substantially more bandwidth than reading data from an RDBMS. Copying data to object storage ahead of time substantially speeds up processing.
- Use Parquetfile whenever possible. Parquetfile is up to ten times smaller, and your jobs only read the data they need rather than entire files
- Partition your datasets appropriately. Most analytics applications only access the last week or so of data. Ensure you partition your data so that recent data is in separate files from older data.
- Identify data skew issues by looking for long-running executors within the Spark UI.
- Avoid driver bottlenecks. Collecting data in Spark sends all the data back to the Spark driver. Perform collect operations as late as possible in your jobs. If you must collect a large dataset, consider scaling the driver node up to a larger VM shape. This ensures you have adequate memory and CPU resources.
- From the Oracle Cloud Infrastructure Console, navigate to Governance.
- Select Limits, Quotas and Usage.
- To request more quota, click Request a service limit increase.
- (Recommended) Upload your Spark code to Oracle Cloud Infrastructure at the end of a CI/CD pipeline. If you take this approach, you don't need to back up your Spark applications, because back-ups are handled elsewhere.
- If you manage code manually, then copy it to many regions.
The main consideration is regional failover. To prepare for this occurrence, create Data Flow Applications in many regions, and synchronize the data between the regions. Regional failover then becomes a matter of invoking the Data Flow APIs in a different region with the correct configuration. Application OCIDs are different in each region.
Common Problems with Jobs
Data Flow jobs fail for many reasons, but most are typically caused by:
- Application errors.
- Out-of-memory errors.
- Transient runtime problems.
- Logs from Oracle Cloud Infrastructure Logging are available if you have followed the steps to Enable Oracle Cloud Infrastructure Logging Logs in Data Flow.
- The Spark UI.
- The Spark log ,
stdoutandstderrstream for the Spark driver and all executors.
Both of these are securely accessed from your browser by loading the Run in question.
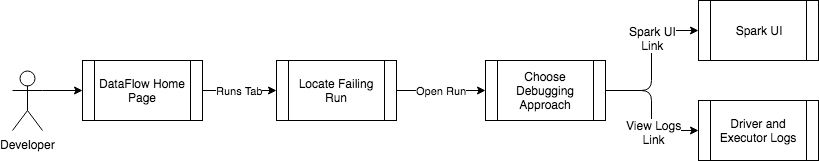
When a job fails, first look at the Driver stderr log file, as most errors
appear here. Next, check the stderr log files for Executors. If the log
files don't contain specific errors, load the Spark UI to allow further investigation of
the Spark application.
- Application errors need to be corrected at source. Then a new Application can be created.
- Tackle out-of-memory errors by running larger instances, by processing less data through fine-grained partitioning, or by optimizing the application to be more efficient.
- Data Flow strives to shield you from transient runtime problems. If they persist, contact Oracle support.
- An invalid request returns a bad request error, which you can see in the log files.
- If the user isn't authorized (but the request is valid), then a
Not Authorizederror is returned.