保存済検索の問合せを自動的に実行するスケジュールの作成
保存済検索を作成した後、保存済検索の問合せを定期的に実行するようにスケジュールし、問合せの実行結果をモニタリング・サービスにルーティングできます。
スケジュール済タスクに関するその他のトピック:
次のステップは、スケジュール済タスクをモニターするためにモニタリング・サービスをターゲットとする方法を示しています。Oracle Logging Analyticsによって発行されるメトリックは、モニタリング・サービスによって格納されます。
-
ナビゲーション・メニューを開き、「監視および管理」をクリックします。「ログ・アナリティクス」で、「管理」をクリックします。「管理の概要」ページが開きます。
管理リソースが、左側のナビゲーション・ペインの「リソース」の下にリストされます。「検出ルール」をクリックします。
「検出ルール」ページがオープンします。「ルールの作成」をクリックします
「検出ルールの作成」ダイアログ・ボックスが開きます。
-
「スケジュール済検索の検出ルール」をクリックします。
-
スケジュール済タスクのルール名を指定します。
-
スケジュールを作成する保存済検索を指定します。最初に、保存済検索が保存されるコンパートメントを選択します。
次に、メニューから「保存済検索」を選択します。
これにより、問合せとその説明などの保存済検索の詳細が表示されます。
-
問合せの実行結果が転送されるターゲット・サービス(
モニタリングなど)を選択します。モニタリング・サービスは、スケジュールに基づいて問合せを実行した結果のメトリックを格納します。
-
メトリック・コンパートメント(メトリックが作成されるコンパートメント)を選択します。コンパートメントは、デフォルトでOracle Logging Analyticsによって選択されます。
-
メトリック・ネームスペース(新しいメトリックを配置するメトリック・ネームスペース)を選択します。ネームスペースの選択に使用できるオプションのスコープは、前のステップのメトリック・コンパートメントの選択によって定義されます。オプションを使用できない場合は、ネームスペースの新しい値を入力することもできます。
-
オプションで、リソース・グループ(メトリックが属するグループ)を選択します。リソース・グループは、カスタム・メトリックで提供されるカスタム文字列です。
-
メトリック名(メトリックを表示するためにモニタリング・サービス・エクスプローラで使用されるメトリックの名前)を入力します。指定できるメトリックは1つのみです。
メトリック・エクスプローラで簡単に識別できるように、保存済検索名をメトリック名に含めることをお薦めします(<mysavedsearchname><metric_name>など)。
-
間隔(集計ウィンドウ)を指定します。選択した分、時間、日または週で実行されるようにスケジュールを最適化できます。さらに、より広範囲の集計(日など)を選択した場合、範囲内でより詳細な集計(問合せを実行する必要がある日の時間など)を指定できます。
-
必要なIAMポリシーがまだ定義されていない場合は、次を行うためのポリシーをリストした通知が表示されます:
- 動的グループの作成
- スケジュール済タスクの実行を許可するポリシーを動的グループに適用
リストされたポリシーを書き留め、それらを作成します。
-
「検出ルールの作成」をクリックします。
これで、問合せが一定間隔で実行されるようにスケジュールされ、結果のメトリックがモニタリング・サービスに発行されます。
-
[スケジュール済み検索検出ルールリスト]ページで、スケジュール済み検索の名前をクリックします。スケジュール済検索の詳細ページで、「メトリック・エクスプローラで表示」をクリックして、モニタリング・サービスのメトリックを表示します。
スケジュール済タスクに対するすべての操作の実行をユーザーに許可 🔗
スケジュール済タスクを作成するには、まず次のIAMポリシーを作成して適切な権限を設定します:
-
スケジュール済タスクが特定のコンパートメントからモニタリング・サービスにメトリックをポストできるようにする動的グループを作成します:
ALL {resource.type='loganalyticsscheduledtask', resource.compartment.id='<compartment ocid>'}または、すべてのコンパートメントからメトリックをポストできるようにするには:
ALL {resource.type='loganalyticsscheduledtask'} -
動的グループがテナンシでスケジュール済タスク操作を実行できるようにするポリシーを作成します:
allow group <group_name> to use loganalytics-scheduled-task in tenancy
allow dynamic-group <dynamic_group_name> to use metrics in tenancy
allow dynamic-group <dynamic_group_name> to read management-saved-search in tenancy
allow dynamic-group <dynamic_group_name> to {LOG_ANALYTICS_QUERY_VIEW} in tenancy
allow dynamic-group <dynamic_group_name> to {LOG_ANALYTICS_QUERYJOB_WORK_REQUEST_READ} in tenancy
allow dynamic-group <dynamic_group_name> to READ loganalytics-log-group in tenancy
allow dynamic-group <dynamic_group_name> to read compartments in tenancy
-
前述のポリシー・ステートメントの一部は、すぐに使用可能なOracle定義のポリシー・テンプレートに含まれています。ユース・ケースにテンプレートを使用することを検討できます。Oracle定義の共通ユースケース用ポリシー・テンプレートを参照してください。
-
動的グループおよびIAMポリシーの詳細は、OCIドキュメント: 動的グループの管理およびOCIドキュメント: ポリシーの管理を参照してください。
-
ポリシーの詳細は、Oracle Cloud Infrastructureドキュメントのメトリック問合せの作成 - 前提条件を参照してください。
-
スケジュール済タスクのAPIリファレンスは、Oracle Cloud Infrastructure APIドキュメントのScheduledTaskリファレンスを参照してください。
APIを使用したコンパートメントのすべてのスケジュール済タスクの表示 🔗
特定の保存済検索のスケジュール済タスクを表示するには、保存済検索の詳細ページにアクセスします。ただし、スケジュール済タスクが作成された保存済検索を参照せずに、特定のコンパートメント内のスケジュール済タスクをすべてリストする場合は、APIを使用してスケジュール済タスクのリストを問い合せます。ListScheduledTasksを参照してください。
GETコマンドで次のパラメータを指定します:
taskType=SAVED_SEARCHcompartmentId=<compartment_OCID>limit=1000sortOrder=DESCsortBy=timeUpdated
コマンドを実行するには、次が必要です:
- ネームスペース: スケジュール済タスクの作成時に指定したログ・アナリティクス・ネームスペース。
- コンパートメントOCID: 作成されたスケジュール済タスクのリストを問い合せるコンパートメントのOCID。
保存済検索のスケジュール済タスクのモニター 🔗
「スケジュール済タスク実行ステータス」メトリックを使用して、保存済検索スケジュール済タスクのヘルスを監視できます。インフラストラクチャの異常のためにタスクの実行が失敗またはスキップした場合、または依存リソースまたは構成が変更された場合、メトリックは失敗の詳細を提供し、修正に役立ちます。
「スケジュール済タスク実行ステータス」メトリックにアクセスするステップは、サービス・メトリックを使用したログ・アナリティクスのモニターを参照してください。
保存済検索のスケジュール済タスクごとに、タスク・スケジュールで指定された独自の間隔があります。メトリックが、スケジュール済タスクの実行ごとにテナンシに発行されます。チャートのデータ・ポイントの上にカーソルを置くと、タスクの詳細が表示されます。ディメンションStatus、DisplayNameまたはResourceIdのいずれかに基づいてメトリック・データをフィルタする場合は、次のステップに従います。
-
「スケジュール済タスク実行ステータス」メトリックの右上隅にある「オプション」メニューをクリックし、「メトリック・エクスプローラでの問合せの表示」を選択します。
これで、メトリックがメトリック・エクスプローラに表示されます。ここで、詳細なチャートを表示できます。
-
「問合せの編集」をクリックして、メトリックのディメンション名およびディメンション値を選択します。メトリック・データは、スケジュール済タスクの実行結果、タスク実行の
Status、タスクのDisplayName、queryExecTimeRangeまたはResourceIdに基づいてフィルタ処理できます。taskResultノート
ディメンション名とディメンション値を指定してメトリック・エクスプローラからチャートおよび表形式データを表示するには、名前にカッコやその他の特殊文字を含むフィールドを使用しないでください。ディメンション名に対して選択したフィールドに特殊文字がある場合は、
evalコマンドを使用して仮想フィールドを作成するか、renameコマンドを使用して既存のフィールドの名前を変更し、カッコまたは特殊文字が削除されるようにします。たとえば、ディメンション名に使用されるフィールドがHost Name (Server)の場合、| eval hostname=“Host Name (Server)”を使用して仮想フィールドhostnameを作成できます。ディメンション
queryExecTimeRangeは、スケジュール済タスク問合せの実行にかかる時間を判断する場合に役立ちます。使用可能な値は、< 5s、>= 5s and < 10s、>= 10s and < 30sおよび> 30sです。通常、実行に30秒以上かかる問合せは、実行時間の面では高価とみなされます。How to Make Your Queries Performantを参照してください。ディメンション
taskResultには、値Succeeded、FailedおよびPausedを指定できます。ディメンションStatusは、taskResultの詳細を提供します。たとえば、taskResultの値がPausedの場合、Status値はPaused by Userになります。「チャートの更新」をクリックして、クラスタ・ビジュアライゼーションをリフレッシュします。チャートには、フィルタを適用したデータ・ポイントのみが表示されます。
収集されたデータ・ポイントが表形式で表示される「データ表」ビューに切り替えることができます。
-
ディメンション名を変更して、チャート内の様々なパースペクティブを表示します。
電子メール、SMS、Slack、PagerDuty、HTTPSエンドポイントURLまたはファンクションを使用して、ステータスについて通知するアラートを設定できます。Create Alerts for Detected Eventsを参照してください。
特定のtaskResult値について、このメトリックを介してレポートされるstatusディメンションの様々な値を次に示します。
taskResult値
|
Status値
|
説明 | 推奨される修正 |
|---|---|---|---|
|
|
|
タスクの実行は正常です |
NA |
|
|
スケジュール済タスクの実行は成功しましたが、メトリック・データの制限により、メトリックをモニタリング・サービスに投稿することは切り捨てられました。 |
メトリックが指定の制限内に残っていることを確認します。OCI CLIコマンド・リファレンス- サービス・メトリック・データの監視を参照してください。 |
|
|
|
スケジュール済タスクの実行が成功したが、問合せで結果が返されなかった場合。そのため、モニタリング・サービスにメトリック・データがポストされていません。 |
保存検索問合せを確認してください。 また、このステータスはエラーを意味しない場合があります。クエリーが書き込まれたイベントが発生していないことを示すだけです。たとえば、問合せで過去5分間のログ内のエラーの数をカウントし、過去5分間に到着したログにエラーがない場合は、 |
|
|
|
2分以上かかる高価な問合せ、またはインフラストラクチャの異常による部分的な結果。 |
ステータス情報については、Oracle Supportにお問い合せください。 |
|
|
|
2分以上かかる高価な問合せ、またはインフラストラクチャの異常による部分的な結果。 |
ステータス情報については、Oracle Supportにお問い合せください。 |
|
|
|
|
インフラストラクチャの異常またはリカバリ可能な障害により、タスクの実行に失敗しました。 |
ステータス情報については、Oracle Supportにお問い合せください。 |
|
|
|
保存検索の問合せ文字列またはスコープ・フィルタが無効です。 |
スケジュール済タスクの作成後に保存済検索が編集されたかどうかを確認し、修正します。 |
|
|
保存検索が削除されるか、保存検索のREAD権限を提供するIAMポリシーが変更されました。 |
IAMポリシーがリストアされていることを確認します。 |
|
|
|
保存検索クエリーはメトリックの生成に有効ではありません。 |
スケジュール済タスクの作成後に保存済検索が編集されたかどうかを確認し、修正します。 |
|
|
|
スケジュール済タスクがログ・データのパージ用であり、パージ・コンパートメントが削除されている場合、またはスケジュール済タスクの作成後にパージのIAMポリシーが変更された場合、このステータスが表示されます。 |
パージ・コンパートメントが削除されているかどうかを確認し、リストアします。 IAMポリシーがリストアされていることを確認します。 |
|
|
|
次の2つの理由のいずれかによって、ステータスがトリガされます。
|
メトリック詳細が不完全または無効な場合は、スケジュール済タスク定義のメトリック詳細を更新します。 メトリック列が数値でないか、ディメンション値がカーディナルでない場合は、保存済検索を更新して有効なメトリックおよびディメンションを生成します。 |
|
|
|
|
スケジュール済タスクの実行を一時停止し、スケジュール済タスクを実行するユーザー処理を識別します。 |
スケジュール済タスクを作成するための重要な要素 🔗
スケジュール済タスクを作成するための次の要因に注意してください。
-
問合せの作成要件:
スケジュール済タスクを作成するための問合せを作成する場合は、次の要件に準拠していることを確認してください。
- 検出ルール問合せに関する次の制限に注意:
-
スケジュール済タスク問合せのフィールド「元のログ・コンテンツ」でワイルドカード検索を実行しないようにします。ワイルドカード検索の詳細は、「キーワード、フレーズおよびワイルドカードの使用」を参照してください。
-
timestatsコマンドの後にeval、extract、jsonextract、xmlextractおよびlookupを指定することはできません。 -
問合せの処理にコストがかかることを回避するために、コマンド
regexをMessageなどの大きなフィールドで使用しないでください。like比較およびextract、jsonextract、xmlextractコマンドは、Messageなどの大きなフィールドではサポートされていません。BY句で使用されるリンク・フィールドまたはフィールドは、Messageなどの大きなフィールドでは使用できません。 -
The commands which are not supported in the queries for scheduled tasks are
addfields,cluster,clustercompare,clusterdetails,clustersplit,compare,createview,delta,eventstats,fieldsummary,highlightgroups,geostats,linkdetails,map,nlpandtimecompare.
-
- 最大限度:
by句でサポートされるフィールドの最大数は3です。timestatsコマンドでサポートされるフィールドの最大数は3です。スケジュール済タスク問合せでサポートされる集計関数の最大数は1です。
- メトリックをポストするためのディメンションとして
linkフィールドの値を使用します:モニタリング・サービスに転記するディメンション・フィールドおよび数値メトリックを3つまで選択します。モニタリングにポストする必要があるフィールドを指定するには、問合せの最後に次の文字を使用する必要があります。
... | link ... | fields -*, dim1, dim2, dim3, metric1linkコマンドには、デフォルトで、開始時間、終了時間、カウントなど、出力に複数の列があります。fieldsコマンドで-*を使用して、これらのフィールドを削除し、オプションで最大3つのディメンション・フィールドと1つの必須メトリック・フィールドを指定します。statsコマンドの後に複数のeval文を、中間結果を計算するために複数のstats関数を持つことができます。ただし、問合せは、ポストする必要があるディメンションおよびメトリックを示すfields -*, dim1, dim2, dim3, metric1で終わる必要があります。検出ルール問合せには、次のガイドラインを使用します。- 最大2個の
addfieldsコマンドを使用します。 - 最大3個の
stats関数を使用します。 - 中間結果と最終結果を計算するには、
eval文が必要です。
問合せの例:
'Log Source' = 'OCI Email Delivery'
 | link 'Entity'
 | addfields [ * | where deliveryEventType = r and bounceType = hard | stats count as 'hard bounces' ],
             [ * | where deliveryEventType = e and length(ipPoolName) > 0 | stats count as 'total sent messages' ]
 | eval 'Total Rate' = ('hard bounces' / 'total sent messages') * 100
 | fields -*, 'Entity', 'Total Rate'
'Log Source' = 'My Network Logs' | stats sum(Success) as TotalSuccess, sum(Failure) as TotalFailure | eval SuccessRate = (TotalSuccess / (TotalSuccess + TotalFailure)) * 100 | fields -*, SuccessRate - 最大2個の
- 検出ルール問合せに関する次の制限に注意:
-
ログの到着遅延:
スケジュールされたタスクがログの到着前に実行された場合、スケジュールされたタスクは予想どおりに結果を返さない可能性があります。到着が遅れたためにスケジュール済タスクにそのようなログが欠落しないようにするには、問合せで時間範囲を調整してログを考慮する必要があります。
たとえば、スケジュール済タスクが5分ごとに実行されて認証エラーの数がチェックされ、ログが生成されてからOracle Logging Analyticsに到達するまでの間に3分の遅延がある場合、スケジュール済タスクはログを検出しません。スケジュール済タスクが5分ごとに、たとえば01:00、01:05、01:10などに実行されるとします。01:04に生成されたログ・レコードL1が、Oracle Logging Analyticsの01:07に達した場合。ログがOracle Logging Analyticsに現時点で到着しなかったため、1:05に実行されたスケジュール済タスクでL1が検出されません。01:10での次の実行中、問合せでは、タイムスタンプが01:05から01:10の間のログが検索されます。このサイクルでも、タイムスタンプが01:04であるため、L1は検出されません。次の問合せでは、ログが遅れて到着した場合、すべてのログ・レコードが表示されない場合があります。
Label = 'Authentication Error' | stats count as logrecords by 'Log Source'Oracle Logging Analyticsへのログの到着の遅延を確認するには、ログ・レコードに記載されているタイムスタンプとログ・プロセッサの転記時間の差を計算します。次の問合せの例を使用すると、遅延があるかどうかを確認できます。
Label = 'Authentication Error' and 'Log Processor Posting Time (OMC INT)' != null | fields 'Agent Collection Time (OMC INT)', 'Data Services Load Time', 'Process Time', 'Log Processor Posting Time (OMC INT)'次の問合せでは、
dateRelative関数を使用して、5分間隔で実行されるタスクの3分の遅延を調整します。Label = 'Authentication Error' and Time between dateRelative(8minute, minute) and dateRelative(3minute, minute) | stats count as logrecords by 'Log Source' -
その他の要因:
-
問合せがモニタリング・サービスにどのように組み込まれるかを理解するには、Oracle Cloud Infrastructureドキュメントのメトリック問合せの作成を参照してください。
-
メトリック・データをモニタリング・サービスに公開するための制限情報に注意してください。制限は、1つのスケジュール済タスクのメトリックに対応しています。Oracle Cloud Infrastructureドキュメンテーションの
PostMetricData APIを参照してください。保存検索で50フィールド別一意値を超える値が生成可能な場合、モニタリング・サービスによって課される制限のために部分的な結果が転記されます。このような場合は、topまたはbottom 50の結果を表示するには、sortコマンドを使用します。
-
スケジュール済タスクの問合せの例 🔗
トピック:
メトリックを表示する問合せの例
-
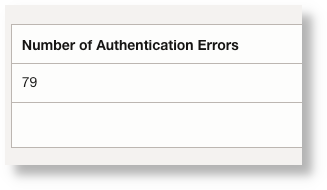
スケジュールされた実行の認証エラーの数を5分ごとに把握する例を考えてみます。
Label = 'Authentication Error' | stats count as 'Number of Authentication Errors'ログ・エクスプローラで「サマリー表」ビジュアライゼーションを選択すると、次の出力が表示されます。

スケジュール済タスクで前述のようなメトリックが実行されるたびに、同じものがモニタリング・サービスにポストされます。
メトリック・エクスプローラから、前述の投稿済メトリックを次のように表示できます。

「データ表の表示」をクリックして、メトリックを表形式で表示します:

-
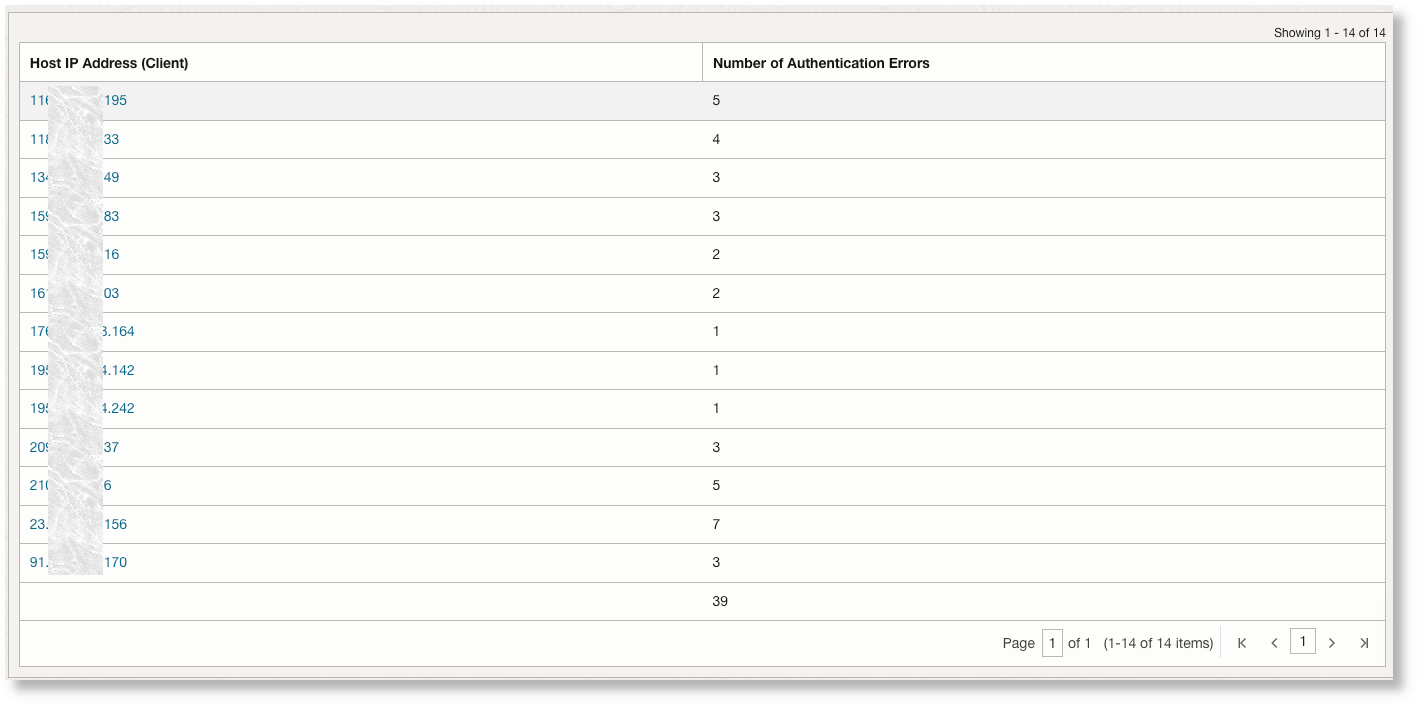
各ホストの認証エラーの内訳を知りたい場合:
Label = 'Authentication Error' | stats count as 'Number of Authentication Errors' by 'Host IP Address (Client)'サマリー・ビジュアライゼーションを使用して、問合せのメトリック出力をプレビューします。

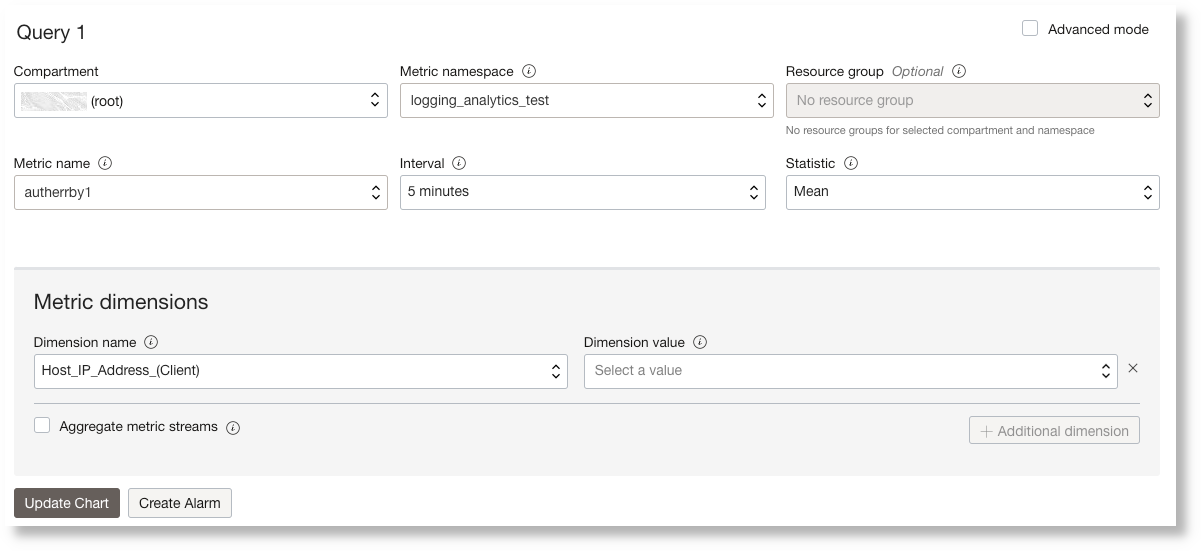
「メトリック・エクスプローラ」ページから、ホストIP別の同じメトリック・チャートは次のようになります。

ホストIP当たりの数を表示するには、メトリック・ディメンション名をHost_IP_Address_Clientとして指定し、「メトリック・ストリームの集計」チェック・ボックスの選択を解除します:

問合せの実行方法
一部の問合せでは、実行時間が長くなるか、場合によってはタイムアウトが発生し、最終的には自身のタスクの実行が遅延します。このような場合は、拡張フィールド(EFD)またはラベルを作成し、スケジュール済問合せのフィルタで使用して問合せのコストを削減することをお薦めします。
たとえば、データベース・アラート・ログの接続タイムアウトの数を5分ごとにポストする場合、次の問合せは実行方法の1つです。
'Log Source' = 'Database Alert Logs' and 'TNS-12535' | stats count as 'Number of Timeouts'前述の問合せでは、「元のログ・コンテンツ」の文字列TNS-12535が検索されます。ただし、これはタイムアウトを検索する最も効率的な方法ではありません。特に、タスクが数百万レコードのスキャンを5分ごとに実行するようにスケジュールされている場合です。
代わりに、このようなエラーIDが抽出されるフィールドを使用して、次に示すようにクエリーを作成します。
'Log Source' = 'Database Alert Logs' and 'Error ID' = 'TNS-12535' | stats count as 'Number of Timeouts'または、ラベルを使用してフィルタすることもできます。
'Log Source' = 'Database Alert Logs' and Label = Timeout | stats count as 'Number of Timeouts'Oracle定義のログ・ソースには、多くのEFDおよびラベルが定義されています。カスタム・ログの場合は、独自のラベルおよびEFDを定義し、「元のログ・コンテンツ」で検索するかわりに、スケジュール済問合せで使用することをお薦めします。ラベルの作成およびソースでの拡張フィールドの使用を参照してください。